Ad placement analytics helps you identify where your ads perform best and where your budget might be wasted. By breaking down performance by platform – like Facebook Feed, Instagram Reels, or Google Display Network – you can make smarter decisions to improve results. Key metrics to focus on include:
- Click-Through Rate (CTR): Measures how well your ad grabs attention in a specific placement. For example, Instagram Stories average 1.34% CTR, while Google Search Ads hit 3.17%.
- Conversion Rate (CVR): Tracks how many clicks lead to actions like purchases or signups. Paid Search averages 4.40% CVR, while Retargeting Display hits 1.42%.
- Cost Per Acquisition (CPA): Shows how much each conversion costs. CPA can vary by 30–50% depending on placement.
- Return on Ad Spend (ROAS): Reveals how much revenue is generated per dollar spent. For example, Google Search often delivers an 8x ROAS, while Meta placements range from 2.5x to 3.0x.
- Viewability and Completion Rate: Ensures your ads are seen and, for videos, tracks how many viewers finish watching.
- Cost Per Click (CPC) & Effective CPM (eCPM): Helps manage budget efficiency by comparing costs across placements.
- Share of Spend: Highlights how much budget is allocated to each placement, identifying potential inefficiencies.
These metrics provide a roadmap to optimize ad spend, reduce waste, and improve performance through performance marketing strategies. For example, refreshing creative every two weeks can prevent CTR drops, and reallocating budgets based on CPA and ROAS can maximize returns.
Every Metric in Advertising Explained (In 5 Minutes or So)
sbb-itb-2ec70df
1. Placement Click-Through Rate (CTR)
Placement CTR is all about understanding how well your ad grabs attention in a specific spot. It’s calculated using this formula: CTR = (Clicks ÷ Impressions) × 100. A high CTR means your ad is resonating with the audience in that placement, showing that your message, format, and audience are in sync.
Think of it as a measure of how relevant your ad is. For example, a quick, engaging vertical video might perform better in Instagram Stories than a static image. Why? Because it fits the platform’s vibe. In fact, ads designed specifically for the platform’s format tend to perform 35% better than recycled content.
Here’s a snapshot of average CTR benchmarks across different placements:
| Placement / Format | Average CTR |
|---|---|
| Google Search Ads | 3.17% |
| Instagram Stories | 1.34% |
| Facebook Feed | 1.11% |
| Native Ads | 1.16% |
| In-Content Display | 0.30% – 1.00% |
| Standard Display Banner | 0.05% – 0.20% |
| Audience Network | 0.10% – 0.40% |
These benchmarks are crucial for context. For instance, a 0.8% CTR on Instagram Stories might seem low compared to Google Search Ads, but it’s actually strong. Why? Because users swipe through Stories much faster than they scroll through a feed, making it tougher to grab their attention long enough for a click.
However, don’t fall into the trap of thinking a high CTR guarantees success. As Alexander Perleman, Head of Product at groas, explains:
"If your CTR is 8% but your conversion rate is 0.5%, you have an ad that’s good at attracting clicks and terrible at attracting customers."
Another thing to keep in mind: CTR tends to drop over time. By day 14, it typically declines, with a 30–40% drop by day 28 if you don’t update your creative. To avoid this, aim to refresh your ads every two weeks to keep performance steady.
Now that you know how to measure engagement, the next step is to see how those clicks translate into actual conversions with Placement Conversion Rate (CVR).
2. Placement Conversion Rate (CVR)
Once you’ve gauged engagement using CTR, the next step is measuring how effective those clicks are with CVR.
Placement CVR calculates the percentage of clicks that lead to a desired action, such as a purchase, form submission, or signup. The formula is straightforward:
CVR = (Conversions ÷ Clicks) × 100
If you notice a strong CTR but a low CVR, it might mean your ad is pulling in the wrong audience or that there’s a mismatch between the ad and the landing page experience.
Getting your creative to align with the placement is crucial for success. For instance, platforms like Meta evaluate ads based on the likelihood of users completing an action – often called the "expected action rate." A video that performs well in the Feed might not do as well in Reels due to differences in user behavior. In fact, creative designed specifically for a placement typically achieves 31% higher engagement rates than repurposed content.
CVR Benchmarks by Placement
CVR expectations can vary widely depending on the placement type and the audience’s intent:
| Placement Type | Avg. CVR | Primary Strength |
|---|---|---|
| Paid Search | 4.40% | High-intent, bottom-funnel |
| Retargeting Display | 1.42% | Re-engaging warm traffic |
| Prospecting Display | 0.34% | Broad reach, awareness |
| Desktop Web | 0.86% | B2B conversions |
| Mobile Web | 0.62% | High volume, impulse discovery |
Before cutting a placement due to low CVR, give it enough time and budget to prove its effectiveness. A good rule of thumb is to allow 14 days and allocate 10% of your campaign spend. Sometimes, all that’s needed is a creative adjustment rather than scrapping the placement altogether.
From here, it’s essential to analyze how these conversions influence your overall campaign costs using CPA metrics.
3. Cost Per Acquisition (CPA) by Placement
CPA is a key metric that shapes how you allocate your ad budget. While CTR shows who’s clicking and CVR reveals who’s converting, CPA tells you the cost of each conversion – and that cost can vary significantly depending on ad placement.
In fact, CPA can fluctuate by 30–50% depending on where your ad is displayed. Even with identical creatives and audience targeting, two placements can yield very different results simply because of the placement itself.
It’s important to avoid being lured in by low CPMs. If conversion rates are inefficient, those low CPMs may not actually save you money.
"A placement with $4 CPM but 50% higher CPA costs more per result than a $10 CPM placement with baseline CPA." – Gaultier D’Acunto, Co-founder, Benly
On Meta platforms, CPA differences between placements are notable. Understanding these variations can help you make smarter budget decisions:
| Placement | Relative CPA vs. Feed | Best Use Case |
|---|---|---|
| Facebook Feed | Baseline | Broad reach, high-intent conversions |
| Facebook Stories | -10% to -20% | Retargeting, urgency-driven offers |
| Facebook Reels | -15% to -25% | Prospecting and awareness |
| Audience Network | +30% to +60% | Reach extension; often high CPA for cold traffic |
Among these, Facebook Reels is particularly interesting right now. With inventory growing faster than advertiser demand in 2026, Reels is currently priced lower than its conversion efficiency warrants. This makes it a strong option for prospecting campaigns, especially those using vertical-native creative.
To make sense of CPA data without overreacting to short-term fluctuations, try the 40% threshold rule: flag any placement where CPA is more than 40% above your campaign average, as long as it accounts for at least 10% of your campaign spend over a 14-day period. If the placement falls below this threshold or timeframe, it’s likely just statistical noise.
Once you’ve reviewed CPA performance, take a closer look at CPC and effective CPM metrics to refine your strategy further.
4. Return on Ad Spend (ROAS) by Placement
Once you’ve analyzed your cost per acquisition (CPA), it’s time to dig into revenue performance to assess the profitability of each placement. This is where Return on Ad Spend (ROAS) comes into play. ROAS measures how much revenue you earn for every dollar spent on advertising, calculated with the formula: ROAS = Total Revenue ÷ Total Ad Spend. For instance, a 4x ROAS means you’re generating $4 in revenue for every $1 spent.
While CPA focuses on cost efficiency, ROAS provides a clearer picture of revenue impact. Looking at ROAS at the placement level can help you uncover inefficiencies that might be hidden in your overall ROAS. For example, Google Search (Brand) placements might deliver a ROAS of 8.0–12.0x in 2026, whereas Meta Advantage+ placements typically range from 2.5–3.0x. Neither figure is inherently good or bad – it all depends on your business context and goals. However, the disparity between these numbers can guide where to invest more heavily.
"A 3x ROAS campaign can destroy cash flow if your margins don’t support it, while a 2x ROAS campaign with strong unit economics can scale sustainably." – MHI Media
It’s important to remember that ROAS is a gross metric, not one that accounts for profitability. It doesn’t include variable costs like product expenses, fulfillment, or returns. Because of this, many businesses are shifting to Contribution Margin ROAS (cmROAS). This metric takes variable costs into account, offering a better view of whether a placement is cash-flow positive. To calculate your break-even ROAS, use the formula: 1 ÷ contribution margin %. For example, a direct-to-consumer (DTC) apparel brand with a 50% contribution margin needs at least a 2x ROAS just to break even.
Keep in mind that branded search placements often report inflated ROAS figures (e.g., 8x–20x), but these numbers can lack true incremental value. Additionally, ad platform dashboards may overstate revenue by 30–60% due to attribution overlap. To get more accurate data, tag each placement with unique UTM parameters and pull revenue numbers directly from your ecommerce backend rather than relying solely on the ad manager. For campaign planning, aim for ROAS targets 1.5x to 2x your break-even point to account for noise from modeled conversions and attribution drift.
Now that you’ve explored ROAS, the next step is to fine-tune your strategy by diving into CPC and effective CPM metrics.
5. Viewability and Completion Rate
Before diving into metrics like clicks or conversions, it’s crucial to ensure your ads are actually being seen. This is where viewability comes into play. It measures whether an ad had the chance to be viewed by a user – not just whether it was served. This metric forms the foundation for all other performance data.
The IAB and MRC set the industry standard for viewability: a display ad is considered viewable if at least 50% of its pixels are on-screen for one continuous second. For video ads, the requirement is slightly higher – 50% of pixels must be visible for at least two continuous seconds. On average, cross-network viewability is 72%, with Connected TV (CTV) leading at 96%, while desktop web banners trail at 64%.
"Viewability is the floor that everything else builds on. An ad that never enters the viewport cannot drive CTR, conversions, or brand lift." – Digital Applied
Ad placement plays a huge role in viewability. For example, sticky mobile footers can achieve viewability rates of 85–95%, while above-the-fold header units average between 55–70%. This is because users often scroll before the page fully loads, reducing the visibility of header placements. To improve viewability, consider placing key ads just below the navigation bar instead of at the very top of the page. Also, avoid lazy loading for above-the-fold units, as it delays ad display and negatively impacts viewability. If a placement has less than 60% viewability, it may be time to reassess its position or adjust the creative.
For video content, Video Completion Rate (VCR) is the next critical metric. While viewability confirms the ad was seen, VCR measures whether it held the viewer’s attention. Benchmarks for VCR vary widely depending on the format. Non-skippable CTV ads on platforms like Hulu and Peacock typically see VCRs of 94–98%. In contrast, skippable YouTube TrueView ads (30 seconds or longer) often range between 15–30%. Tracking quartile milestones – such as 25%, 50%, 75%, and 100% – can reveal where viewers drop off, offering insights to improve the content.
"Completion rate is a strong signal of relevance and pacing. While not every video needs to be watched in full to be effective, consistently low completion rates can indicate that content is too long or misaligned with viewer expectations." – Tom Rennell, Head of Content & Communications, Adverity
Together, viewability and VCR serve as a diagnostic duo. High viewability paired with low VCR typically points to a creative issue – the ad is being seen but fails to engage. On the other hand, low viewability with decent VCR suggests a placement issue – the ad resonates with those who see it, but not enough people are getting the opportunity.
Once you’ve addressed viewability and VCR to ensure engagement quality, you can move on to analyzing metrics like CPC and effective CPM to fine-tune ad performance further.
6. Cost Per Click (CPC) and Effective CPM
Let’s break down two key metrics: Cost Per Click (CPC) and Effective CPM (eCPM). CPC tells you how much you’re paying for each click on your ad, while eCPM converts costs into a per-1,000 impressions format. This makes it easier to compare campaigns across different pricing models. Together, these metrics help refine budget decisions and creative strategies, often starting with a Google Ads audit while also setting the stage for evaluating click quality and user engagement.
CPC works best for placements where users show high intent, like search ads. On the other hand, eCPM is more relevant for awareness-focused campaigns, such as video or display ads. For reference, the average CPC on Google Search in 2026 is about $2.69, compared to $0.63 on Google Display. LinkedIn, known for its precise B2B targeting, has CPCs ranging from $5.00 to $15.00. When it comes to CPM, LinkedIn leads with rates between $25 and $50, whereas TikTok offers a more budget-friendly range of $8 to $15.
However, it’s crucial to avoid common traps when analyzing these metrics. Chasing the lowest CPC without considering click quality can lead to misleading results. As Larry from AdLibrary explains:
"Lower CPM does not mean better performance. A placement with €8 CPM delivering 0.4% CTR generates fewer clicks per euro than a placement with €14 CPM delivering 1.8% CTR."
If you notice a rising CPC alongside a declining click-through rate (CTR), it’s often a sign of creative fatigue rather than a problem with your bidding strategy. In such cases, refreshing your creative assets usually solves the issue. Similarly, low CPCs paired with poor downstream conversions might indicate accidental clicks or low-intent traffic, which is common on mobile platforms like Stories and Reels. To measure genuine engagement, calculate Cost Per Quality Click (CPQC) by dividing your spend by the number of sessions lasting over 10 seconds.
7. Share of Spend and Budget Allocation by Placement
When analyzing ad performance, metrics like CPC and eCPM are just the tip of the iceberg. Digging deeper into share of spend – the percentage of your total budget assigned to each placement – can uncover inefficiencies that might otherwise go unnoticed. Allocating budgets wisely can amplify the conversion benefits seen in other metrics.
This metric often highlights "placement leaks", which auditors frequently flag. For instance, automated platforms like Google’s Performance Max may allocate disproportionate budgets to underperforming placements like Audience Network or Display. While these algorithms can look efficient on paper, they rarely deliver strong conversions. For a well-optimized Performance Max campaign in 2026, at least 60% of the budget should go to Search and Shopping. If Display or YouTube placements consume 50% or more, it’s a clear sign of inefficiency. Recognizing and addressing these leaks is key to reallocating budgets more effectively.
Take this real-world example: In 2026, Vikram, the founder of a DTC home goods brand, discovered that 65% of his $35,000 monthly Google budget was tied up in a single Performance Max campaign. Shockingly, only 8% went to Search, 12% to Shopping, and 41% was funneled into Display retargeting. By cutting Performance Max to just 20% of his total spend and rebuilding manual Search and Shopping campaigns, Vikram managed to recover between $8,000 and $12,000 in monthly spend within just 90 days. As Aditya Chaturvedi, Founder of BTB Audits, aptly puts it:
"Performance Max should be a small additive layer on top of a healthy manual Search and Shopping account. Not the engine."
Another challenge arises when a single placement or ad set consumes 60–70% of your budget. This can lead to audience saturation and rising CPAs. To avoid this, many marketers follow the 70-20-10 rule: allocate 70% of your budget to proven performers, 20% to testing variations of successful strategies, and 10% to exploring new or experimental placements. This method keeps revenue stable while identifying opportunities in underutilized areas.
For ongoing budget management, a good rule of thumb is to cut or significantly reduce spending on placements with CPAs that are twice your target after a four-week trial period. Additionally, when reallocating budgets, avoid shifting more than 20% at once. Doing so can trigger a learning phase reset in automated bidding systems, which can disrupt performance.
All the metrics discussed – from CTR and CVR to CPA, ROAS, viewability, CPC, and share of spend – create a comprehensive toolkit for assessing ad placements and making informed, data-driven budget decisions. Together, they provide a roadmap for smarter ad spend and better results.
Comparison Table
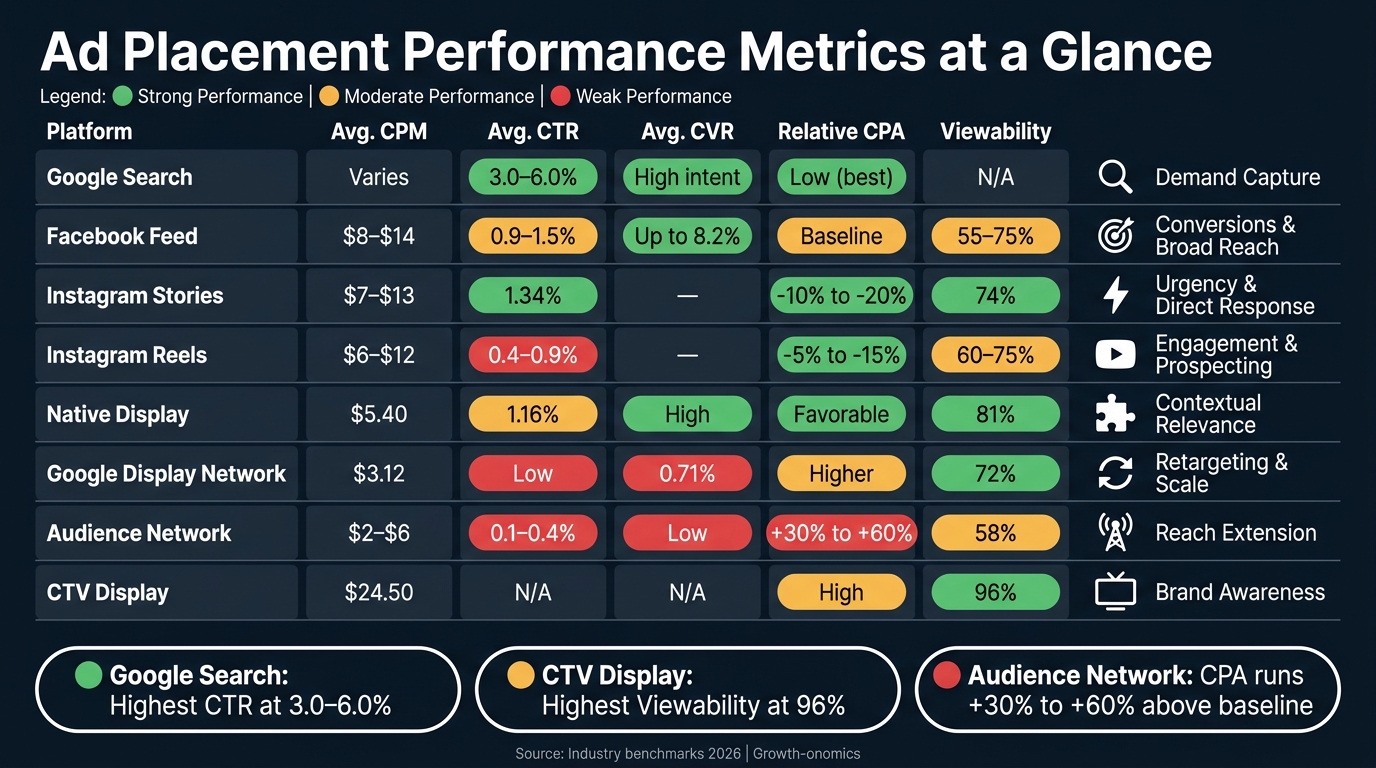
Ad Placement Metrics Comparison: CTR, CVR, CPA & Viewability by Platform
No single ad placement outshines the rest across all metrics. The key is selecting placements that align with your specific goals while managing trade-offs. Below is a table summarizing the key metrics for various platforms, offering a quick snapshot of their strengths and limitations.
| Placement | Avg. CPM | Avg. CTR | Avg. CVR | Relative CPA | Viewability | Best For |
|---|---|---|---|---|---|---|
| Facebook Feed | $8–$14 | 0.9–1.5% | Up to 8.2% | Baseline | 55–75% | Conversions & broad reach |
| Instagram Stories | $7–$13 | 1.34% | – | -10% to -20% vs. baseline | 74% (mobile) | Direct response & urgency |
| Instagram Reels | $6–$12 | 0.4–0.9% | – | -5% to -15% vs. baseline | 60–75% | Engagement & prospecting |
| Facebook Search | Varies | 1.2–2.0% | – | -10% to -20% vs. baseline | N/A | High-intent users |
| Google Search | Varies by vertical | 3.0–6.0% | – | Low (high intent) | N/A | Demand capture |
| Audience Network | $2–$6 | 0.1–0.4% | Low | +30% to +60% vs. baseline | 58% | Reach extension only |
| Native Display | $5.40 | 1.16% | High engagement | Favorable | 81% | Contextual relevance |
| CTV Display | $24.50 | N/A | N/A | High | 96% | Brand awareness & attention |
| Google Display Network | $3.12 | Low | 0.71% | Higher | 72% avg. | Retargeting & scale |
Understanding these metrics is essential for making informed decisions about ad placements. Some key trends emerge from the data. For instance, Google Search delivers the highest CTRs (3.0–6.0%), thanks to its ability to capture high-intent users. Meanwhile, social media placements like Instagram Stories and Reels often achieve better CPAs than Facebook Feed, as their lower CPMs help balance out performance.
On the other hand, Audience Network offers low CPMs but tends to result in higher CPAs – 30–60% above baseline. Automated ad platforms may allocate a significant portion of your budget to this placement, sometimes without clear indicators of its effectiveness.
"The goal with benchmarks isn’t to hit an exact number. It’s to identify what’s working, what’s wasting budget, and where strategic testing can close the gap." – Lornah Ngugi, Marketing Writer, WebFX
CTV Display is a unique case. With a $24.50 CPM and an impressive 96% viewability, it excels at ensuring your ad is seen, though it doesn’t generate direct clicks. This makes it a strong choice for brand awareness campaigns, particularly when paired with lower-funnel placements like Google Search or Facebook Feed.
This table and analysis provide a framework for identifying the placements that best align with your campaign’s goals and budget.
Conclusion
Metrics like CTR, CVR, CPA, ROAS, viewability, CPC, eCPM, and share of spend are more than just numbers – they’re powerful indicators of how well your budget is working. Without tracking performance at the placement level, your strategy risks losing focus. These insights let you make real-time adjustments that can amplify your campaign’s effectiveness.
For example, refining your strategy can lead to a 35–50% reduction in CPA, while managing placements carefully can cut costs by up to 18%. Using multi-placement strategies? You could see improvements of around 29%. These results are at the core of Growth-onomics‘ performance-driven marketing approach, ensuring every dollar you spend works harder for you.
"If you don’t base your marketing campaign decisions on data, you’re just guessing." – Growth-onomics
By leveraging tools like GA4, Google Tag Manager, and Looker Studio, Growth-onomics maps the entire customer journey. This data-driven strategy doesn’t just deliver short-term wins – it supports growth that lasts.
Ad placement analytics isn’t a one-and-done process. Businesses that commit to continuous optimization uncover better opportunities, minimize wasted spending, and increase returns – all without simply throwing more money at the problem.
FAQs
Which ad placement metrics matter most for my goal?
When selecting ad placement metrics, the key is aligning them with your business goals and where your audience is in the sales funnel. For customer acquisition, you’ll want to keep an eye on new customer cost per acquisition (nCPA) and new customer return on ad spend (nROAS). On the other hand, if you’re focusing on brand awareness, metrics like reach, frequency, and viewability should take center stage.
To gauge performance, use viewability and click-through rates (CTR) as early indicators. Meanwhile, metrics like conversion rates and ROAS provide a clearer picture of overall success. However, watch out for high bounce rates – they can be a red flag for excessive ad density, which might hurt the user experience.
How can I tell if a placement is just noisy data or truly underperforming?
To pinpoint underperforming placements while filtering out noisy data, focus on comparing key metrics – like conversion rate, CPC (cost-per-click), and CPA (cost per acquisition) – against your account’s averages. Here’s what to keep an eye on:
- Placements with high spend but zero conversions
- Conversion rates that are less than half of your account’s average
- CPCs that are more than double the average
Also, flag any placements with a large number of impressions but questionable or irrelevant domain names. For the best results, analyze performance within 5- to 7-day windows to gather actionable insights. If you need guidance, Growth-onomics can help fine-tune your strategy.
How can I track placement-level ROAS accurately when attribution is inflated?
To get a clearer picture of your ROAS without inflated attribution, steer clear of depending entirely on platform-reported metrics. These metrics often inflate performance figures by as much as 30–60%. Instead, focus on backend revenue data from your e-commerce platform or CRM for a more reliable view.
You can also improve accuracy by implementing server-side tracking, which helps fill in data gaps, and applying deduplication logic to avoid counting the same conversions multiple times. Opt for shorter attribution windows, such as a 7-day click, to reduce overestimation. Additionally, run quarterly incrementality tests – methods like geo-testing can help you measure the actual causal impact of your campaigns.