The short answer: the same $5,000–$10,000/month ad budget can buy more than 10x more impressions in one industry than another.
If I want a fast read on this article, here it is:
- Automotive gets some of the most low-cost reach, with YouTube around $2.90 CPM
- Health Care is the clear high-cost outlier, with Display around $35.07 CPM
- Retail, Real Estate, and Travel often get large impression volume on Display at about $3.12 CPM
- Technology & SaaS can get cheap top-of-funnel reach, but tight targeting often limits scale
- Search usually brings far fewer impressions than Display or YouTube, but much higher click rates
- Impressions are not reach: if frequency climbs, impression counts can look big even when the audience size is not
In plain English: if you compare ad impressions without looking at industry, channel, CPM, CTR, and intent, you can misread performance fast.
What Is CPM? Digital Marketing Metric Definitions
sbb-itb-2ec70df
Quick Comparison
| Industry | Lowest-cost reach channel in the article | Example cost | Main takeaway |
|---|---|---|---|
| Retail & eCommerce | Display | $3.12 CPM | Big reach, but Search and Shopping bring stronger buying intent |
| Technology & SaaS | Display / YouTube | $3.12–$3.90 CPM | Reach is cheap, but audience size and targeting narrow volume |
| Health Care | YouTube over Display | $7.10 CPM on YouTube, $35.07 CPM on Display | Highest impression costs in this set |
| Real Estate | Display / YouTube | $3.12–$3.50 CPM | Reach scales, but local demand limits Search volume |
| Automotive | YouTube | $2.90 CPM | Strong low-cost awareness channel |
| Travel & Hospitality | Display / YouTube | $3.12–$3.50 CPM | Good mix of low CPM reach and high-intent Search traffic |
A few numbers stand out right away. A $10,000/month budget in Automotive YouTube can buy about 3.45 million impressions. That same $10,000/month in Healthcare Display gets about 285,142 impressions. That gap alone tells most of the story.
I’d use this article as a simple benchmark guide, not a fixed scorecard. The best way to read it is:
- check your channel
- match it to your industry
- compare CPM, CTR, and spend
- then compare that to your own account history
Bottom line: use channel-specific and industry-specific benchmarks. One average for all campaigns is too broad to be useful.
1. Retail & eCommerce
Retail and eCommerce campaigns can put up huge impression numbers, but the gap between channels is hard to ignore. Some formats buy reach at a low cost. Others bring fewer impressions, but the people behind those impressions are much closer to buying.
Monthly Impression Volume
If you’re looking at a $5,000 or $10,000 monthly budget, Display and YouTube give you the most visibility per dollar. Search, by contrast, delivers far fewer impressions because clicks cost more, but those impressions tend to come from people with stronger purchase intent [1].
| Channel | Avg. Cost Metric | $5,000/mo | $10,000/mo |
|---|---|---|---|
| Display | $3.12 CPM | ~1,602,000 | ~3,205,000 |
| YouTube | $3.50 CPM | ~1,428,000 | ~2,857,000 |
| Google Shopping | $0.66 CPC / 0.86% CTR | ~880,000 | ~1,760,000 |
| Ecommerce Search | $3.49 CPC / 6.66% CTR | ~21,500 | ~43,000 |
For Shopping and Search, those impression estimates come from spend, CPC, and CTR. For Display and YouTube, they come from CPM [1].
CPM Efficiency
On a pure CPM basis, Display is cheap at $3.12, and YouTube is close behind at $3.50 [1]. Both sit far below the overall Google Ads median CPM of $12.79 [1].
That price gap helps explain where retail budgets are moving. As Search CPCs climb, more spend is shifting toward lower-cost impression channels like Shopping and Performance Max [1].
CTR Context
Big reach doesn’t always mean big traffic. That’s the trade-off.
Display averages a 0.46% CTR, while Search averages 6.66% [1]. Google Shopping lands between them at 0.86% CTR [1]. That may not sound huge at first glance, but Shopping also has a low CPC of $0.66, which makes it one of the better options for driving qualified traffic at scale.
The post-click picture matters too. Display is built for reach, not click depth. Shopping converts at 1.91%, compared with 0.57% for Display [1]. So while Display can flood the top of the funnel, Shopping tends to pull more weight when you care about what happens after the click.
Channel Fit
Each channel plays a different role.
- Display and YouTube are better for awareness
- Google Shopping helps with product discovery
- Search captures high-intent buyers
- Performance Max can blend these formats across the funnel
Retail can often win with scale. SaaS usually works differently, where impression volume is lower and tight audience targeting matters more.
2. Technology & SaaS
SaaS and tech campaigns don’t look much like retail. The audience is smaller, the sales cycle takes longer, and raw impression volume usually isn’t the top goal. Instead, SaaS teams care more about job titles, company size, and industry. Put simply, tech and SaaS give up some scale in exchange for tighter targeting.
Monthly Impression Volume
If the goal is reach, Display and YouTube drive the most impressions. At a $5,000 monthly budget, Google Display Network delivers about 1,602,500 impressions at a $3.12 CPM [1]. YouTube for Tech/Electronics lands at about 1,282,000 impressions at a $3.90 CPM [1].
| Channel | Avg. Cost Metric | $5,000/mo | $10,000/mo |
|---|---|---|---|
| Google Display | $3.12 CPM | ~1,602,500 | ~3,205,000 |
| YouTube (Tech/Electronics) | $3.90 CPM | ~1,282,000 | ~2,564,000 |
At the $10,000 level, the pattern stays the same. Display leads on pure reach, while YouTube still offers strong volume at a low cost.
CPM Efficiency
Low CPM only helps if your targeting is still tight. That’s the tradeoff.
YouTube’s $3.90 CPM for technology and electronics campaigns looks efficient next to Healthcare at $7.10 or Finance at $5.80 [1]. For SaaS brands that want awareness without chewing through budget too fast, that matters. You can stay visible without paying a premium every time your ad shows.
Display is still the cheapest path to scale. But there’s a catch: its 0.46% CTR [1] means most of those impressions won’t turn into clicks. So yes, it’s great for reach, but not every eyeball will move further down the funnel.
CTR Support
When you look at engagement, Search is where tech and SaaS tend to shine. B2B technology search ads average a 6.82% CTR [2]. That’s a very different story from LinkedIn, which averages just 0.22% CTR [2].
This is why Search often does the heavy lifting for demand capture. People there are already looking, comparing, and weighing options. LinkedIn, on the other hand, is more like a sniper than a net. It can hit the right person, but clicks are sparse and the cost is high. That makes it a better fit for going after a specific decision-maker than for chasing low-cost impressions.
Channel Fit
Because the audience is narrower, the goal shifts from mass reach to account-level visibility. Display and YouTube sit at the top of the funnel, where low CPMs and broad reach help keep your brand in front of the market. Search picks up existing demand from people already researching solutions.
LinkedIn plays a smaller but useful role. It’s expensive, low-volume, and highly targeted, which can make sense when you need to get in front of a certain buyer or buying group.
In SaaS, impressions often do less to drive instant action and more to support nurturing across a longer buying cycle.
3. Health Care
Health care has the highest impression costs in this benchmark. The main reasons are pretty straightforward: the audience is high-value, competition is intense, and rules around ads are strict [1].
Monthly Impression Volume
Healthcare display CPMs average $35.07. That’s about 11x higher than the all-industry average of $3.12 [1].
Put in plain English: a $5,000 monthly budget buys only about 142,571 display impressions in health care. Spend that same amount in an average industry campaign, and you’d get roughly 1,602,564 impressions [1].
YouTube looks much less expensive here. In Healthcare & Insurance, it averages a $7.10 CPM. Even so, that still makes it the highest CPM category on YouTube [1].
| Channel | CPM | $5,000/mo Impressions | $10,000/mo Impressions |
|---|---|---|---|
| Google Display | $35.07 | ~142,571 | ~285,142 |
| YouTube (Healthcare) | $7.10 | ~704,225 | ~1,408,451 |
CPM Efficiency
If the goal is awareness, YouTube is the better buy for healthcare advertisers. At $35.07 CPM, display delivers far fewer impressions than YouTube at $7.10 [1].
CTR Support
Search paints a different picture.
The average CTR for Health & Fitness on Google Search is 6.44%, and specialty searches can hit 10.96% [1][2]. That kind of engagement often comes from urgency. People usually aren’t browsing these searches for fun – they’re looking for answers, care, or the next step [2].
Search CPC is also fairly moderate at $3.52, especially next to the $5.26 all-industry average [1].
Channel Fit
For healthcare advertisers, search does most of the heavy lifting for patient acquisition because it reaches high-intent queries at a moderate cost. YouTube helps with awareness at a small share of display’s cost, while display makes more sense for retargeting than for cold reach at this CPM [1].
Real estate benchmarks shift again because local intent and market size change both reach and cost.
4. Real Estate
Unlike health care, real estate is shaped less by regulation and more by local market size. It sits in an interesting middle ground: you need broad visibility, but demand is still tightly tied to a specific area. In practice, results come down to local intent, geography, and how well your visuals match the market.
Monthly Impression Volume
In real estate, impression volume is driven more by local demand than by budget alone, especially in Search. There are only so many people searching for homes, apartments, or agents in a given area. So even if spend goes up, smaller markets can still put a ceiling on impressions.
| Channel | CPM | $5,000/mo Impressions | $10,000/mo Impressions |
|---|---|---|---|
| Google Display | $3.12 | ~1,602,564 | ~3,205,128 |
| YouTube | $3.50 | ~1,428,571 | ~2,857,143 |
CPM Efficiency
If the goal is raw impression volume, Display and YouTube lead the pack. Display is the main option for broad local reach when frequency matters more than pure scale. Put simply, if you want people in one market to keep seeing your brand, Display usually does that job best.
CTR Support
Search is the clearest read on local demand. It’s not just a traffic channel.
Real estate search ads average a CTR of 8.21% to 9.20% [1][2], which is well above the all-industry average of 6.42% to 6.66% [1][2]. Average search CPC is also fairly low at $2.81, compared with the cross-industry mean of $5.26 [1].
That mix makes Search a strong lead gen channel. But it doesn’t always scale well. Average Search conversion rate in real estate is 3.28%, below the all-industry average of 7.52% [1]. So the clicks are there, but the final decision often takes time. That makes sense – buying or renting property isn’t an impulse move.
Channel Fit
Search reaches people who are actively looking right now. Display and YouTube help build the awareness and repeat exposure needed during a longer decision cycle. Social platforms like Facebook sit somewhere in between. Real estate ads there average around 1.6% CTR [3], which makes them useful for visual storytelling and local targeting, but not as efficient as Search for direct lead capture.
Automotive brings a different mix of inventory, intent, and geography.
5. Automotive
Automotive is tougher to benchmark because it splits into two very different buckets: Sales and Repair, Service & Parts. They don’t move the same way. Search behavior, speed to convert, and the channels that matter most all change depending on what the customer needs.
That’s why impressions only tell part of the story. For sales campaigns, impressions help you judge reach and scale. For service campaigns, intent matters more because people are often looking for help now, not browsing.
Monthly Impression Volume
YouTube is the lowest-cost reach channel in this set, with a CPM of $2.90 [1]. Google Display Network is close behind at $3.12. Based on those CPMs, here’s what monthly impression volume looks like at $5,000 and $10,000 monthly budgets:
| Channel | CPM | $5,000/mo Impressions | $10,000/mo Impressions |
|---|---|---|---|
| YouTube | $2.90 | ~1,724,138 | ~3,448,276 |
| Google Display Network | $3.12 | ~1,602,564 | ~3,205,128 |
CTR Support
For Automotive Sales, search ads post an average CTR of 8.12% to 8.29% [1][3]. That’s well above the all-industry average of 6.42% to 6.66% [1][2].
Repair, Service & Parts lands lower on CTR at 5.56% [1][3], but this is where the story shifts. Its conversion rate hits 14.67%, the highest of any industry tracked [1]. And the cost per lead is only $28.50 [1], compared with the all-industry average of $70.11 [1].
So the same metric doesn’t mean the same thing across both segments. In sales, CTR is a strong read on demand quality. In repair and service, it’s more about urgency.
Channel Fit
For automotive, channel fit comes down to the job each campaign needs to do. Search is where intent shows up. YouTube gives you scale. Display helps add secondary reach.
In plain English: don’t judge automotive on impressions alone. Look at intent first, then conversion efficiency.
6. Travel & Hospitality
Travel and hospitality is a strong fit for paid media because it blends high-intent search traffic with broad reach from display and video. Search helps you show up when people are ready to book. Display and YouTube help you stay in front of them earlier, when they’re still planning and weighing options [2].
CTR Support
You can see that intent in the click-through rates. Travel’s average Search CTR is 8.57%, which is well above the all-industry average of 6.66% [1]. Performance also shifts by segment: Hotels & Resorts hit 3.4% in the #1 search ad position, while Aviation comes in at 1.4% [3].
CPM Efficiency
Costs are also favorable. Travel Search CPC averages $2.12, and Restaurants & Food averages $2.05. Both are below the all-industry average of $5.26 [1]. On the awareness side, Google Display Network averages $3.12 CPM, while YouTube averages $3.50 CPM [1].
Monthly Impression Volume
That pricing gives travel brands a lot of room to scale reach without blowing through budget.
| Channel | CPM | $5,000/mo Impressions | $10,000/mo Impressions |
|---|---|---|---|
| Google Display Network | $3.12 | ~1,602,564 | ~3,205,128 |
| YouTube | $3.50 | ~1,428,571 | ~2,857,143 |
YouTube also offers a Cost Per View (CPV) of just $0.02–$0.03 [1]. For brand campaigns, that’s a strong setup. You can get in front of a large audience while people are still daydreaming, researching, and narrowing down choices.
Channel Fit
Search is the best fit for bookings. Display and YouTube work well for awareness, especially during peak planning periods when travelers are comparing destinations, flights, hotels, and prices [2]. Mobile matters a lot here too, since a big share of travel research happens on phones [2].
These trends lead straight into the cross-industry comparison below.
How the Industries Compare Across Four Key Metrics
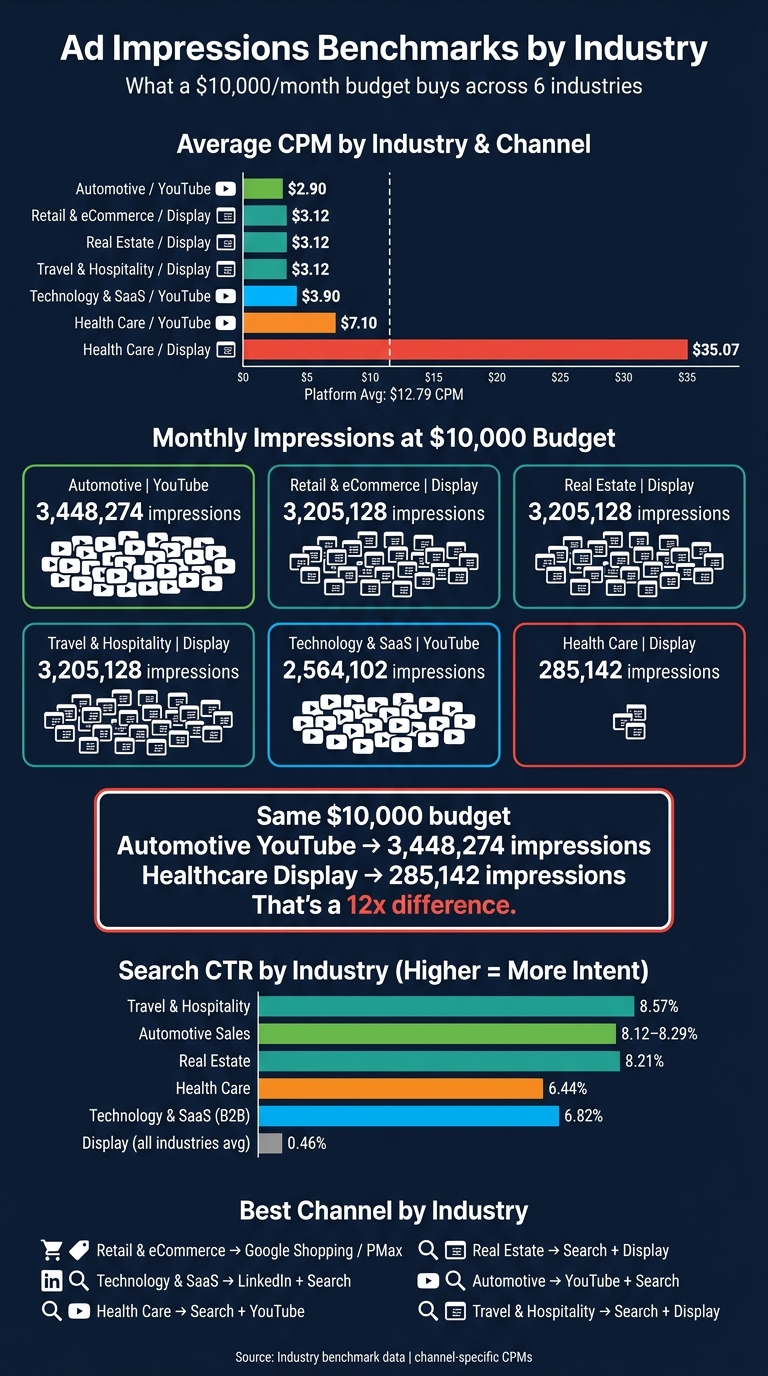
Ad Impressions by Industry: CPM Benchmarks & Monthly Reach at $10K Budget
The same ad budget can go a lot further in one industry than another. Across these six industries, reach, cost, and engagement can shift fast based on channel. The tables below make those differences easy to compare side by side.
Monthly impression volume by industry
Reach changes a lot by industry. Automotive gets the most volume through low-cost YouTube, while Health Care gets the least through Display.
| Industry | Channel | CPM | $5,000/mo Impressions | $10,000/mo Impressions |
|---|---|---|---|---|
| Automotive | YouTube | $2.90 | ~1,724,137 | ~3,448,274 |
| Retail & eCommerce, Travel & Hospitality, Real Estate | Google Display | $3.12 | ~1,602,564 | ~3,205,128 |
| Technology & SaaS | YouTube | $3.90 | ~1,282,051 | ~2,564,102 |
| Health Care | Display | $35.07 | ~142,571 | ~285,142 |
CPM efficiency by channel and industry
Lower CPMs usually buy more reach. But more reach doesn’t always mean better traffic.
When to run a Google Display Network campaign often depends on your goals; Display and YouTube tend to have lower CPMs than Search, which makes them a better fit for awareness when volume matters. Search, on the other hand, is built for higher-intent conversion [1]. That tradeoff matters. For example, Technology & SaaS lands on the lower end of the CPM range with $3.90 on YouTube, but Search still brings in people with stronger intent.
CTR support and what it means
CTR helps show whether impressions are doing anything beyond showing up on a screen. If people click, the reach is getting attention.
Travel leads Search CTR at 8.57%, with Real Estate close behind at 8.21% and Automotive at 8.12% [1]. Health Care comes in at 6.44% on Search [1]. That’s below those top three, but still a solid number for a high-intent channel.
This is why CTR matters so much. It tells you if low-cost reach is just cheap, or if it’s also useful.
Best-fit channels for each industry
Channel fit depends on two things: where your audience spends time and what they want when they see your ad.
| Industry | Best-Fit Channel | Why It Works |
|---|---|---|
| Retail & eCommerce | Google Shopping / PMax | Visual product intent; low CPC ($0.66) [1] |
| Technology & SaaS | LinkedIn / Search | B2B targeting; high-intent search [2] |
| Health Care | Search / YouTube | High-intent queries; lower display cost [1] |
| Real Estate | Search / Display | Local intent on Search; Display for branding |
| Automotive | YouTube / Search | Lowest YouTube CPM ($2.90) for awareness at scale [1] |
| Travel & Hospitality | Search / Display | Search for booking intent; Display for inspiration |
What $5,000 and $10,000 monthly budgets can produce
A $10,000/month budget can deliver very different results depending on the channel and industry.
For example, an Automotive brand spending $10,000/month on YouTube can expect about 3,448,274 impressions at a $2.90 CPM. A Health Care advertiser putting that same $10,000/month into Display would get about 285,142 impressions at a $35.07 CPM [1].
That’s a gap of more than 10x in reach at the same spend. So impressions should be used as context, not as the goal itself. Industry averages help frame what’s normal, but they shouldn’t be treated like fixed targets.
Pros and Cons of Using Industry Averages for Benchmarking
Industry benchmarks are a starting point, not the finish line. They work best when you put them next to your own performance data.
Where industry averages help
Benchmarks give new campaigns a place to start. Without them, estimating budget for a certain impression count or lead goal is mostly guesswork.
They also help spot delivery issues. If a campaign lands well below the normal range for its channel, it’s a good cue to check targeting, creative, and tracking, or request a free Google Ads audit to identify leaks. And when you need to explain results to a stakeholder, a benchmark gap is usually easy to show and easy to understand.
Where industry averages can mislead
Averages smooth out a lot of variation. Seasonality alone can shift performance in a big way. Google Search ads saw 11% more clicks and 13% more spend in Q4 2025, pushed by holiday demand [1]. If you only look at annual averages, those seasonal jumps can disappear.
Auction swings make things even messier. The average CPC across all industries went up 12.88% year over year in 2025, and 87% of industries saw higher costs [1]. That means benchmarks can get old fast.
They also leave out things that matter a lot in day-to-day campaign performance, like creative quality and ad fatigue. Two advertisers in the same industry can end up with very different costs, even if their budgets look similar. Local market competition can also change the picture.
| Pros | Cons |
|---|---|
| Sets a baseline for normal performance [1] | Can be skewed by seasonal spikes like Q4 click growth [1] |
| Helps justify budgets [1] | Benchmarks age quickly as CPCs rise [1] |
| Supports more realistic KPI-setting across industries [2] | Misses creative quality and ad fatigue [2] |
| Can miss local market competition differences [2] |
How to use benchmarks without over-relying on them
Treat industry averages like guardrails, not a fixed target. Compare them with your own first-party campaign data. If your past CPM is often lower than the industry average, that number is the baseline that matters most for you.
That’s also why channel-specific benchmarks matter more than one catch-all average. Use benchmarks to frame expectations, then judge results against your own past performance. The next takeaway is simple: benchmark by channel and industry, not by a single average.
Conclusion
Key takeaways by industry and channel
Travel and Automotive often combine high volume with strong CTRs and lower CPCs. Automotive also stands out as one of the lowest-cost industries on YouTube, at $2.90 CPM [1]. On the other side of the range, Health Care is the clearest high-cost, low-volume outlier.
The reason is pretty simple: each channel works on a different performance marketing economic model. Display and YouTube are built for low-cost reach. Search is built for intent. That shows up in the numbers, with an average CTR of 6.66% on Search versus 0.46% on Display [1].
Use channel-specific benchmarks, not one universal target
That’s why a single benchmark doesn’t work for every campaign. A Healthcare advertiser on the Google Display Network can face CPMs as high as $35.07 [1] – more than 10 times the platform average. If you compare that against a broad industry average, the read on performance will be off.
Instead, line up your U.S. campaign data with the right channel and industry benchmark. If your Display CPM stays below $3.12 [1], that gives you a solid baseline. If your Search CTR falls behind the 6.66% average [1], that’s a sign to dig deeper, not just a stat to glance at.
Benchmarks show the market. Your first-party data shows how you’re doing. Use both.
FAQs
How should I benchmark my industry?
Start with data you can trust from your ad platforms. Break it out by channel, geography, device, and campaign objective so you’re not lumping very different results into one average.
Use a 28- to 30-day baseline, then compare it with year-over-year performance. That helps smooth out short-term swings and seasonal noise.
For metrics like CPC, CTR, and conversion rate, don’t lean on one headline number. Look at the full performance range instead. That gives you a clearer view of where your tactics actually land.
Why aren’t impressions the same as reach?
Reach is the number of unique people who see your content. Impressions are the total number of times your content appears, including repeat views from the same person.
That means impressions are usually higher than reach. Why? Because the same person can see the same ad more than once.
The link between the two is called frequency:
impressions ÷ reach
So if your ad gets 1,000 impressions and reaches 250 people, your frequency is 4. In plain English, each person saw the ad about four times on average.
Which channel best fits my budget?
The best channel for your budget depends on your goals and industry. That’s because CPC and CAC benchmarks can vary a lot.
Google Ads can bring in immediate, high-intent traffic, but it often comes with a higher price tag. Display ads are usually less expensive and work well for brand awareness. Facebook can deliver lower-cost engagement.
If you’re thinking longer term, SEO and referral programs often lead to a lower CAC than paid advertising.