Pull up your search terms report and set the date range to the last 90 days. Sort by cost, descending. Read the first 30 rows.
Somewhere in there is a query with the word “jobs” in it. Another with “free.”
Probably one containing a competitor’s name that has nothing to do with your product, and at least one where somebody was clearly looking for a tutorial rather than a vendor.
Add up what those cost.
That number is usually smaller than the real waste, because the expensive kind does not look like waste at all. It looks like a campaign hitting its cost-per-lead target while producing leads sales quietly stops calling. It looks like a broad match keyword with good volume and reasonable conversion rates. It looks like a well-run account.
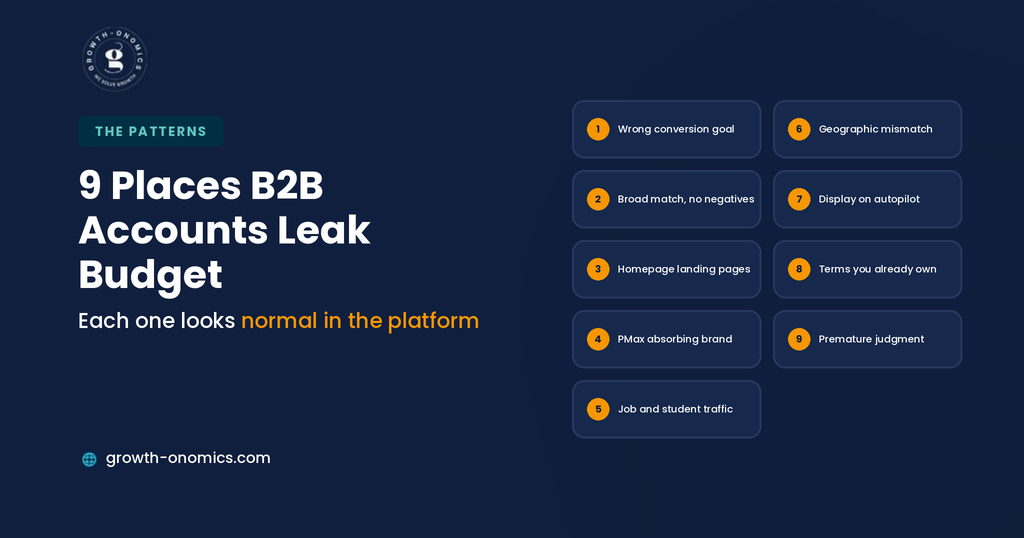
The 9 problems below are the ones that show up repeatedly in B2B SaaS audits. Some are obvious once you look. Several are invisible in the platform and only appear when you filter by opportunity in the CRM.
Each one includes how to find it in your own account and what fixing it involves, because the diagnosis is the hard part; the fixes are mostly straightforward.
Why B2B Waste Is Hard to Spot
Consumer accounts waste money visibly. Someone buys, or they do not, and a campaign that is not converting shows up in a week. B2B has 3 structural features that hide the same problem for months.
The feedback loop is slow. With a 90-day sales cycle, the campaign burning budget in January does not reveal itself until April at the earliest. By then it has spent a quarter’s worth.
The intermediate metric looks fine. Cost per lead is the number most teams watch weekly, and it stays healthy in exactly the campaigns producing unqualified volume. The waste is invisible at the layer where anyone is looking.
Automated bidding actively pursues it. Feed the platform a form-fill conversion and it optimizes toward people who fill in forms, which means a campaign gets progressively better at generating the wrong thing. The metric improves while the outcome worsens.
That combination is why B2B ad waste tends to be discovered rather than noticed. Someone finally joins spend data to opportunity data, and a quarter of the budget turns out to have been buying activity rather than pipeline.
It also explains why the discovery usually happens during a budget review rather than a campaign review. Nothing inside the ads platform reports a problem, because by its own definitions there is not one; the campaign is meeting the objectives it was given, efficiently, every week.
Quick Comparison
| # | Waste Pattern | Where to Find It | Fix Effort |
| 1 | Wrong conversion goal | Conversion settings | Medium, high impact |
| 2 | Broad match, no negatives | Search terms report | Low, ongoing |
| 3 | Homepage as landing page | Ad group destinations | Medium |
| 4 | PMax absorbing brand | Campaign comparison | Low |
| 5 | Job and student traffic | Search terms report | Low |
| 6 | Geographic mismatch | Location reports | Low |
| 7 | Display on autopilot | Placement reports | Low |
| 8 | Bidding on owned terms | Paid and organic overlap | Medium |
| 9 | Premature judgment | Reporting cadence | Low |
1. Optimizing Toward the Wrong Conversion
The most expensive mistake on this list, and the one most accounts make by default.
What It Looks Like
Smart Bidding optimizing toward a form submission; an ebook download, a newsletter signup, a webinar registration rather than toward a qualified opportunity. The campaign gets cheaper per conversion every month and worse per SQL at the same time.
How to Find It
Check what conversion action your bidding strategy targets. If it is anything a non-buyer would complete willingly, the platform is being trained to find non-buyers. Then compare cost per lead against cost per opportunity by campaign divergence between the 2 rankings is the confirmation.
The Fix
Import offline conversion data so opportunity creation and closed-won events flow back to Google against the original click identifier. This is a tracking project rather than a campaign setting, and it usually takes a few weeks. Growth-onomics treats it as prerequisite work in paid engagements, because every other optimization in the account is downstream of what the platform is told to chase.
2. Broad Match Without a Negative Strategy
What It Looks Like
Broad match keywords with automated bidding and a negative list that was written at launch and never revisited. Google’s matching has become considerably looser, and the queries it pulls in drift over time.
How to Find It
Run the search terms report for the last quarter, sort by cost, and read every term above a spend threshold you care about. Most accounts find something startling in the first 20 rows.
The Fix
Weekly negative keyword review for the first 2 months of any campaign, then monthly. Build a shared negative list for account-wide exclusions like jobs, free, tutorial, DIY, salary, open source, and campaign-specific lists for category noise. This is unglamorous maintenance that nobody schedules, and everybody needs, and the cost of skipping it grows because loose matches beget looser ones as the campaign learns.
3. Sending Every Query to the Homepage
What It Looks Like
An ad promising a comparison, an integration, or a specific solution, landing the click on a general homepage that mentions none of it.
How to Find It
Export your ad groups with their final URLs. Any group where the destination does not directly address the keyword theme is leaking money, and the leak is worst on your most expensive terms, since those carry the most specific intent.
The Fix
Match the page to the query. Competitor terms need a comparison page, integration terms need that integration’s page, and high-intent product terms need a page about that product. This is a content project as much as a paid one, which is why it stalls in most organizations; the paid team cannot ship the page and the content team is not measured on ad performance. It typically improves conversion rate more than any bidding change available, so it is worth escalating rather than working around.
4. Letting Performance Max Absorb Branded Traffic
What It Looks Like
A PMax campaign reporting excellent cost per acquisition, running alongside a branded search campaign whose volume mysteriously declined. PMax is capturing brand queries and reporting them as acquisition.
How to Find It
Compare branded search impression share before and after PMax launched. If branded volume fell while PMax volume rose, you are paying acquisition attention to demand you already had.
The Fix
Apply brand exclusions at the campaign level. Then re-evaluate PMax performance without brand traffic inflating it, which is frequently a different conversation than the one you were having. Expect the reported cost per acquisition to rise sharply; that is the correction working.
5. Paying for Job Seekers and Students
What It Looks Like
Queries containing “jobs,” “careers,” “salary,” “certification,” “course,” “tutorial,” “how to become,” and “free.” In some categories this accounts for a meaningful share of wasted spend before anyone filters it.
How to Find It
Search terms report, filtered for those patterns. Also check whether Dynamic Search Ads are targeting your entire domain, since careers pages and blog archives are the usual culprits.
The Fix
Account-level negative list covering the obvious patterns, plus restricting DSA targeting to specific page sets rather than the whole site. Both are afternoon jobs, and together they are the highest return per hour of work in this article. Re-run the search terms report a fortnight later, because new variants surface as matching adapts.
6. Ignoring the Geographic Reality of Your Product
What It Looks Like
Global or broad regional targeting for a product that only sells in specific markets, or location settings including “people interested in your targeted locations” for a product where physical location genuinely matters.
How to Find It
Run a location report by cost and conversions. Then check whether your location option is set to presence or to presence-plus-interest; the second setting quietly widens your audience well beyond where you sell.
The Fix
Restrict targeting to markets where you can actually sell, support, and comply. For SaaS, this includes data residency and regulatory constraints, instead of just language coverage. Exclude locations producing volume without opportunities rather than hoping they improve, and check the setting again after any campaign is duplicated, since the default travels with the copy.
7. Running Display on Autopilot
What It Looks Like
A display campaign launched to “support” search, running for quarters, delivering cheap conversions on placements nobody has ever reviewed: mobile games, parked domains, content farms.
How to Find It
Placement report, sorted by cost. Look for app placements, domains you do not recognize, and anything where a B2B buying committee is implausible.
The Fix
Exclude mobile apps entirely unless you have a specific reason not to, review placements monthly, and consider managed placements on industry publications instead of broad audience targeting. If display cannot show influenced pipeline after two quarters, it is a brand spend and should be budgeted as one rather than defended as performance.
8. Bidding on Terms You Already Own
What It Looks Like
Paying for clicks on queries where you hold position one organically and face no competitor bidding, typically on long-tail informational terms rather than brand.
How to Find It
Join your search terms report to Search Console data and identify terms where you rank first organically, no ads appear from competitors, and you are still buying clicks.
The Fix
Pause those terms and monitor total clicks for a few weeks. The nuance is that branded terms are usually worth defending even when you rank first, because competitors bid on them and the ad occupies space above your own result. Non-branded terms where you rank first and no competitor advertises are the genuine waste, and they are straightforward to identify once you look at both data sources together rather than either alone.
9. Judging Campaigns Before the Sales Cycle Closes
What It Looks Like
Pausing a campaign in month two because cost per lead looks high, or scaling one because it looks cheap; in both cases before any opportunity data exists.
How to Find It
Look at your last 4 budget decisions and check what data supported them. If the answer is conversion volume and cost per lead, you have been optimizing on a proxy.
The Fix
Report cohorts rather than months: spend from a given month tracked forward against the opportunities it eventually produced. Keep a real-time operational view for optimization decisions, and use the cohort view for budget decisions — the two answer different questions and conflating them is what produces premature cuts. Growth-onomics agrees these windows with finance at the start of an engagement, because the campaign that looks worst in month two is frequently the one producing pipeline in month five, and restarting a cancelled campaign costs more than waiting did.
The 90 Minute Audit
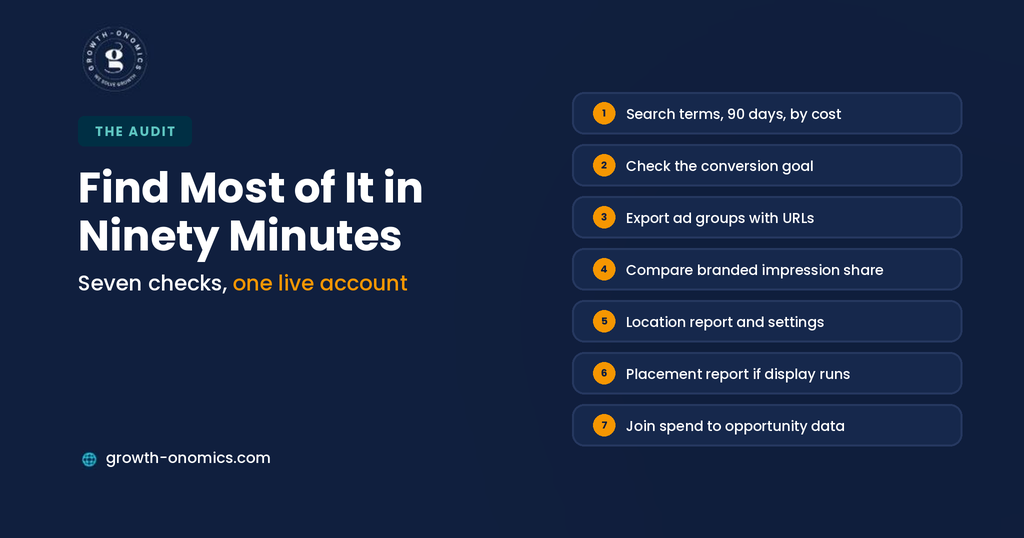
Run these in order on your live account. It is a half-morning job that finds most of what is above.
Search terms report, 90 days, sorted by cost. Read the top 50 rows and flag anything you would not have bid on deliberately. Read them rather than scanning, because the problematic terms usually look plausible at a glance and only fail on closer reading.
Check the conversion action behind your bidding strategy. If it is a form fill rather than an opportunity, note it as finding number one and read no further into optimization theory until it is fixed.
Export ad groups with final URLs. Look for homepage destinations on high-intent terms.
Compare branded impression share before and after any PMax launch. Check brand exclusions are applied.
Location report by cost and conversions. Check the presence versus interest setting.
Placement report if display is running. Sort by cost and look for apps and unrecognized domains.
Pull 4 months of spend and join it to opportunity data. Rank campaigns by cost per opportunity and compare against the cost-per-lead ranking. Where the two orders differ, the cost-per-lead view has been misleading you.
Document findings as a prioritized list with estimated recovery rather than a bug report. Most of these fixes take under a day, and the total recovered is usually a meaningful share of the account.
Note which findings need someone outside the paid team, like landing pages need content, offline conversions need CRM access, because those are the ones that stall without an owner named at the time of the audit.
Conclusion
The uncomfortable pattern across all 9 is how normal each looks in the platform. Broad match with reasonable conversion rates. A display campaign delivering cheap leads. Performance Max beating every other campaign on cost per acquisition. None of it triggers an alert, because Google reports on the goal you gave it and every one of these is hitting that goal efficiently.
Which is why the relevant audit isn’t inside Google Ads at all. It is joining spend to opportunity data and seeing whether the campaign ranking changes. When it does, and it almost always does, the gap between the two rankings is your waste, and it is usually concentrated in a handful of places rather than spread thin across the account.
Start with the conversion signal, because everything downstream inherits it. Then work through the search terms report, landing page mismatches, and brand exclusions, which together take a day and typically recover more than a month of optimization tinkering. The rest is maintenance you schedule rather than a project you complete.
If you want your paid account audited against pipeline rather than platform conversions, the Growth-onomics team can run the analysis and prioritize the findings by what they actually recover.
FAQs
How much Google Ads budget do B2B SaaS companies typically waste?
There’s no credible universal figure, and numbers quoted in this category usually come from vendors selling a fix. What is consistent in audits is where the waste concentrates rather than how large it is: irrelevant search terms from loose matching, spend optimized toward the wrong conversion event, brand traffic misattributed as acquisition, and display placements nobody reviews. The useful exercise is measuring your own; join 90 days of spend to opportunity data, rank campaigns by cost per opportunity, and compare that against your cost-per-lead ranking. The difference between the two orderings is your answer.
Should B2B SaaS companies avoid broad match entirely?
No, but broad match without active negative management is where most search waste originates. Google’s matching has loosened considerably, so a broad keyword pulls in adjacent queries that share a topic but not an intent. Broad match works when 3 conditions hold: the bidding strategy optimizes toward qualified conversions rather than form fills, the negative list gets weekly attention early in a campaign’s life, and someone actually reads the search terms report. Without those, exact and phrase match will usually outperform it on cost per opportunity even at higher CPCs.
Is Performance Max wasting my budget?
It might be, and the most common mechanism is brand absorption. PMax spans Google’s inventory optimizing toward your conversion goal, and branded queries are the cheapest conversions available, so without brand exclusions it captures demand you already had and reports it as acquisition. Check whether branded search volume declined when PMax launched. Beyond that, the same rule applies as everywhere else: if PMax is optimizing toward form fills, it will find cheap form fills efficiently. Feed it opportunity data and its performance becomes a genuine result rather than a flattering one.
How do I know if my landing pages are the problem?
Compare conversion rate by ad group against the specificity of the destination. Groups sending high-intent queries to a homepage will underperform groups sending the same traffic to a matched page, usually by a wide margin, and the gap grows with how specific the query was. The clearest test is a single change: take your most expensive ad group currently pointing at the homepage, build a page addressing that exact query, and compare four weeks before and after. It is the fastest way to size the opportunity across the rest of the account.
Do agencies and in-house teams waste budget differently?
They tend to fail in different directions. Agencies managing many accounts default to structures and settings that are safe across clients, which produces competent accounts with generic negative lists and landing pages nobody built for the specific query. In-house teams know the product and the ICP far better but often lack the time for weekly search term review, so waste accumulates in the maintenance layer rather than the strategy layer. The overlap is the conversion signal; both frequently optimize toward form fills, because fixing that requires CRM work neither side owns alone.
What should I fix first?
The conversion signal, without exception. Every automated bidding decision in the account is downstream of what you told the platform to optimize toward, so fixing keyword structure, landing pages, or budgets while the goal is wrong improves the efficiency of pursuing the wrong outcome. Import opportunity data first, then work through the search terms report and landing page mismatches, which are the two highest-return manual fixes. Display placements, geographic settings, and reporting cadence follow. The order matters more than the individual fixes.