


You already know the answer is in there. That’s what makes it maddening.
Someone asks which pages lost traffic last month and why. You open Search Console, click Performance, add a filter, add another, switch to comparison mode, export to a spreadsheet, build a pivot, squint at it.
35 minutes later, you have answered one question and 3 more have occurred to you that you now do not have time to check.
A Search Console MCP connection collapses that loop. The assistant queries the Search Console API directly, so “which pages lost more than 20% of clicks month over month, and did their average position move” is a sentence rather than an afternoon.
The follow-up question costs another sentence.
One thing to be clear about before you go looking: there is no official Google Search Console MCP server. Google has shipped more than 50 MCP servers, including an official read-only one for Google Analytics, and Search Console is not among them.
Every GSC MCP you will find is a community project wrapping the public Search Console API. They work. They are just not Google’s, which means the vetting is yours.
Here are 10 things B2B SaaS teams use the connection for, in rough order of how quickly each pays back, plus the setup and limits worth knowing before you build a habit on it.
Availability was checked earlier this year.
Before You Connect Anything
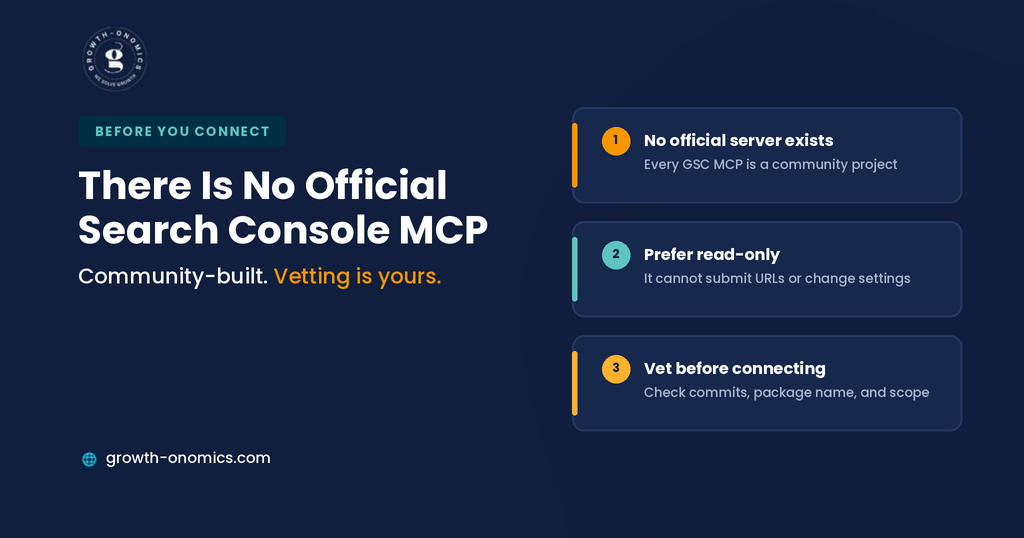
Three practical decisions determine whether this works or becomes a support ticket.
Pick a server and read its scope. Community options range from 4 read-only tools: list sites, search analytics, URL inspection, and sitemaps to servers with 20 or more tools covering the Indexing API, Core Web Vitals data, cannibalization detection, and automated audits. More tools aren’t automatically better. A read-only server cannot accidentally submit a URL for indexing, which is a feature rather than a limitation for most marketing teams.
Choose your authentication. Service account setup means creating a Google Cloud project, enabling the Search Console API, downloading a key file, and adding the service account email as a user on your property. OAuth-based servers are friendlier for non-engineers but require trusting the implementation with account access. Either way, grant the minimum property access needed.
Vet the code. Since no official server exists, you are running someone’s open-source project against your Search Console account. Check the repository’s recent commits, whether the package name has changed, and whether it is read-only. At least one popular server changed npm package names in 2026, leaving people pointed at a stale package and wondering why their tool list looked wrong.
None of this is difficult. It is 15 minutes of care that prevents the 2 failure modes that occur: connecting to an abandoned project or granting write access to nobody.
One more decision worth making early is which property you connect. Teams running several domains, staging environments, or client accounts should connect the minimum set rather than everything visible, because an assistant with access to every property will occasionally answer confidently about the wrong one.
Quick Comparison
| # | Use Case | Question It Answers | Time Saved |
| 1 | Traffic drop diagnosis | What fell, and was it position or demand? | 30+ min per incident |
| 2 | Striking distance keywords | What is nearly on page one? | Hours per quarter |
| 3 | Cannibalization detection | Which pages compete with each other? | Hours per audit |
| 4 | Indexation auditing | What is not indexed and why? | Hours per audit |
| 5 | Branded vs non-branded | Is growth real or just brand? | 20 min per report |
| 6 | Refresh measurement | Did the update actually work? | 20 min per page |
| 7 | Segment analysis | Where does performance differ? | Ad hoc, repeatedly |
| 8 | Monthly reporting | What changed and why? | Half a day per month |
| 9 | Query drift | Are searches getting longer? | New analysis entirely |
| 10 | Live executive answers | Whatever was just asked | The follow-up meeting |
1. Diagnosing a Traffic Drop in One Question
The highest-value use, because it happens under time pressure and the manual version is slow.
The question: “Compare the last 28 days to the previous 28 days. Which pages lost more than 15% of clicks, and for each one show whether impressions or average position moved.”
Why it beats the interface: That single query separates the 3 causes of a traffic drop that look identical on a line chart: you lost rankings, the queries lost search demand, or your click-through rate fell while position held. Search Console can show you all 3; it just makes you run 3 separate comparisons to see them.
What to watch: Data lag means the most recent days are incomplete. Always compare equivalent, settled windows rather than letting the assistant pick the last 7 days against the previous seven, which will show a phantom decline every single time.
2. Finding Striking Distance Keywords
The question: “Show queries with average position between 8 and 20, more than 200 impressions in the last 90 days, and a click-through rate below one percent, grouped by landing page.”
Why it beats the interface: This is the highest-return content work available to most SaaS sites, and it is tedious to assemble by hand because it requires filtering on 3 dimensions at once and grouping the output. As one query, it takes seconds, and the grouping by page tells you whether the fix is one page or 12.
What to watch: Position averages hide distribution. A query averaging position 11 might rank 4 on desktop and 25 on mobile, so segment before committing effort.
3. Detecting Keyword Cannibalization
The question: “Find queries where more than one URL received impressions in the last 90 days, and show the click split between them.”
Why it beats the interface: Search Console will happily show you pages per query, one query at a time. Finding the pattern across a whole site is a job for an export and a pivot table, which is why most teams never do it. Some GSC MCP servers ship dedicated cannibalization tooling; others answer it through analytics queries.
What to watch: Multiple URLs ranking for a query is not automatically a problem. It counts when clicks are split across pages that should be consolidated, or when the wrong page is winning.
4. Auditing Indexation at Scale
The question: “Inspect these 15 URLs and report indexing status, canonical selected by Google, last crawl date, and any coverage issues.”
Why it beats the interface: URL inspection is one URL at a time in the interface. Batching it across a launch set, a template group, or a migration cohort turns a tedious afternoon into a minute. Pair it with sitemap listing to check whether submitted URLs are actually being read.
What to watch: API quotas apply, and inspection is more expensive than analytics queries. Batch deliberately rather than pointing an agent at a thousand URLs.
5. Separating Branded From Non-Branded Performance
The question: “Split total clicks and impressions into branded and non-branded using these brand terms, monthly for the last 12 months.”
Why it beats the interface: Regex filtering exists in Search Console, but doing this properly means running it twice per period and assembling the comparison yourself. As a single query you get the trend you care about whether organic growth reflects new demand or your brand campaign working.
What to watch: Define brand terms carefully, including misspellings and product names. This split is also foundational for AI visibility work: a rising branded search trend alongside flat non-branded is often the fingerprint of AI-assisted discovery, where buyers learn about you in an assistant and then search your name directly. Growth-onomics tracks that pairing alongside citation data for exactly this reason, since the branded lift is frequently the only trace an AI-influenced journey leaves in your analytics.
6. Measuring Content Refreshes Properly
The question: “For these 6 URLs updated on March 12, compare the 28 days before to the 28 days after, showing clicks, impressions, position, and the top 10 queries for each period.”
Why it beats the interface: Refresh measurement requires per-URL, pre-and-post comparison across 4 metrics, which is 6 separate manual comparisons for 6 pages. Doing it as one query means refreshes actually get measured rather than assumed to have worked.
What to watch: Isolate the change. If you refreshed content the same week you shipped internal linking changes or a site migration, the comparison attributes everything to the refresh.
7. Segmenting by Device, Country, and Intent
The question: “Show performance by country for the last quarter, and flag any market where average position is more than 3 places worse than the site average.”
Why it beats the interface: Segment analysis is where Search Console’s dimension limits bite. Combining device, country, and query patterns in one view requires exports; through MCP it is one question, and the follow-up “now show me which pages drive that gap in Germany” is another.
What to watch: Small segments produce noisy averages. Set a minimum impression threshold in the question itself.
8. Building the Monthly Report Without the Export
The question: “Pull last month versus the prior month: total clicks, impressions, average position, top 20 gaining pages, top 20 declining pages, and branded versus non-branded split. Format as a summary with the 5 most notable changes explained.”
Why it beats the interface: This is the single largest time saving on the list. Report assembly typically consumes half a day of exporting, reconciling, and charting, and none of that half-day is analysis. The assistant assembles; you interpret.
What to watch: The assistant will explain changes confidently, including ones that are noise. Treat its narrative as a first draft of the interpretation rather than the interpretation, and check that anything it calls significant clears your normal week-to-week variance.
9. Spotting Query Drift Toward AI-Style Phrasing
The question: “Compare query length distribution and question-format queries between this quarter and the same quarter last year.”
Why it beats the interface: Search Console has no view for this at all. As buyer research shifts toward conversational interfaces, the queries that still reach your site change shape: longer, more specific, more often phrased as questions. Watching that distribution move is one of the few signals available inside your own data about how discovery behavior is changing.
What to watch: This is directional evidence. Query mix shifts for many reasons, including your own content targeting longer phrases.
10. Answering Executive Questions Live
The question: Whatever was just asked in the meeting.
Why it beats the interface: The actual change is not any single query but the collapse of the loop between question and answer. “Is that decline in the US or everywhere?” used to be a follow-up email. Now it is answered before the conversation moves on, which changes how much scrutiny SEO reporting can survive and how quickly decisions get made.
What to watch: Speed makes errors more expensive. Sanity-check surprising numbers against the interface before anyone acts on them, particularly in a room where a decision is being made.
What MCP Cannot Do for SEO
4 limits, all structural rather than temporary. Knowing them prevents the disappointment that follows an enthusiastic first week.
It cannot watch anything. MCP is request-response. Nothing happens until you ask, so a page falling off page one, a query halving week over week, or a spike in coverage errors will not tell you. There is no “when this happens, alert me.” Genuine monitoring still needs a scheduled job, an automation platform, or a purpose-built tool.
It only knows Search Console. One server, one data source. Pairing a ranking drop with analytics data, the content calendar, and a note in Slack means connecting a server for each and hoping the client handles them in one turn.
It inherits every Search Console limit. Data lag of 2 to 3 days, row limits on returned data, 16 months of history, and anonymized queries stripped from the report. The assistant cannot see data Google does not expose, though it will sometimes phrase an answer as though it can.
You own the plumbing. No official server means no vendor accountability when the API changes, no security review, and no support. That is a manageable trade for a read-only analytics connection and a poor one for anything with write access.
Making It a Habit
Most teams connect a GSC server, run 5 impressive queries, and never open it again. 3 things separate the setups that stick.
Save your questions. The value grows when the same well-constructed queries run every month with the same thresholds and windows. Keep them in a shared document so the diagnostic is repeatable and comparable rather than reinvented each time.
Standardize the windows. Fix your comparison periods: 28 days against the prior 28, quarter against prior quarter, and state them in every question. Inconsistent windows are the fastest way to produce two contradictory answers to the same question in a fortnight.
Keep the interpretation human. The assistant is excellent at assembly and confident at explanation, and those are different skills. When Growth-onomics builds reporting workflows, collection is automated and the narrative stays with someone who knows what shipped that month, because a plausible explanation for the wrong cause is worse than no explanation.
Conclusion
The honest summary is that a Search Console MCP connection does not tell you anything Search Console could not. Every number is available through the interface, and the API has been public for years. What changes is the cost of asking, and that cost was the real constraint all along.
When a question takes 30 seconds instead of 35 minutes, you ask the second and third question instead of stopping at the first. That’s where the growth sits, not in any single query, but in the fact that a traffic drop gets diagnosed properly rather than explained plausibly, and a refresh gets measured rather than assumed to have worked.
Set it up carefully, given that no official server exists. Read-only, minimum access, a server you have actually looked at. Then save the questions that work, standardize your windows, and keep the interpretation with a person who knows what your team shipped last month.
If you want search performance reporting connected to conversions and pipeline rather than sitting in its own tab, the Growth-onomics can build the analysis layer around it.
FAQs
Is there an official Google Search Console MCP server?
No. Google has released more than 50 MCP servers covering BigQuery, Maps, Drive, Gmail, and others, and Google Analytics has an official read-only server, which is exactly why people assume Search Console does too. It does not. Every Search Console MCP available is a community project wrapping the public Search Console API. Several are well maintained and genuinely useful, but the vetting responsibility is yours: check recent commit activity, confirm whether the server is read-only, and verify you are installing the current package rather than a renamed or abandoned one.
What can I actually ask it?
Anything the Search Console API exposes, which is most of what the interface shows: clicks, impressions, click-through rate, and average position, filtered and grouped by query, page, country, device, date, and search appearance. Most servers also support URL inspection for indexing status and sitemap listing. The advantage is combining those dimensions in one question; striking distance queries grouped by landing page, or a month-over-month comparison split by branded and non-branded rather than running several filtered views and assembling the result yourself.
Is it safe to connect Search Console to an AI assistant?
It depends on the server and the permissions you grant. A read-only server using a service account with access to a single property is a low-risk connection: the assistant can read search performance data and cannot change anything. Risk rises with servers that include the Indexing API or sitemap submission, since those can take actions against your property. Prefer read-only for marketing use, grant access to only the properties needed, keep credential files out of version control, and review what is still connected periodically.
Can it alert me when rankings drop?
No, and this is the most common misunderstanding. MCP is request-response; nothing happens until you open a chat and ask. There is no trigger mechanism, so a ranking drop, a click decline, or a coverage error spike cannot start anything. For genuine monitoring, you need a scheduled job that runs the query and posts the output somewhere, an automation platform, or a dedicated rank tracking tool. The MCP connection is for investigation and analysis, not for watching.
How do I stop the assistant inventing an explanation?
Ask it to separate what the data shows from what it thinks caused it, explicitly, in the question. A prompt ending with “report the numbers first, then list possible causes and mark which are supported by the data and which are speculation” produces a far more usable answer than one asking why traffic fell. Search Console shows what happened, not why, and an assistant filling that gap will offer a plausible narrative: algorithm update, seasonality, competitor activity with no evidence for any of it. The causes usually live in your release log and content calendar, not in the API.
Do I still need my rank tracker and SEO platform?
Usually yes, for different jobs. Search Console reports your own performance in Google, which is ground truth but limited to your property and to Google. It cannot tell you competitor rankings, backlink profiles, keyword volumes, or how you appear in AI answers. An MCP connection makes your own data dramatically faster to interrogate; it does not replace market and competitive data. The practical setup is Search Console via MCP for owned performance, plus whichever platforms you already trust for everything outside your domain.
