Multiple regression is a way I can forecast sales, leads, or revenue by looking at several drivers at once – not just one.
If I want a forecast I can use, this is the short version:
- I pick one outcome, like weekly revenue or monthly leads
- I test several inputs, like Google Ads spend, price, discounts, and seasonality
- I use past data – often 12 to 36 months – to estimate how each input links to the result
- I validate the model on newer data, not just the data it learned from
- I use the output for budget plans, pricing tests, and what-if scenarios
In plain English, multiple regression helps me answer questions like:
- What might happen if I add $5,000 to paid search next month?
- Did sales grow because of ads, lower prices, or holiday demand?
- Is my model accurate enough to trust for inventory or budget decisions?
Here’s the main takeaway: multiple regression is useful when demand has several drivers and I have clean, aligned history to test them. But it can break down when channels move together too closely, when the data is messy, or when the market changes fast.
A few points matter most:
- Coefficients estimate how much one input changes the outcome, with other inputs held steady
- Intercept shows baseline demand
- Error terms show what the model missed
- Holdout testing matters more than in-sample fit
- MAE, RMSE, MAPE, and R-squared each tell me something different about forecast quality
If I had to sum up the full article in one line, it would be this: multiple regression gives me a practical way to connect marketing inputs to business results, as long as I keep the model simple, test it on future periods, and update it as conditions shift.
Forecasting (15): Multiple regression method for forecasting
The Core Parts of a Multiple Regression Model
Once the basic idea clicks, the next step is simple: know the parts of the model. A multiple regression model has three main parts: the outcome, the drivers, and the error.
Dependent Variable: The Forecast Target
The dependent variable is the thing you want to forecast. It’s the specific result the model is trying to predict.
That means you should pick an outcome that lines up with the decision in front of you, like weekly revenue, monthly recurring revenue, or booked appointments. To get results you can rely on, build the model using at least 12 to 24+ months of steady, consistently recorded historical data.
Once the outcome is set, you can move to the inputs that affect it.
Independent Variables: The Drivers Behind Demand
Independent variables are the measurable factors that drive demand.
These can include things like ad spend, price, discounts, seasonality, and outside conditions such as weather. The key point here is easy to miss: choose variables based on business logic, not just because the data happens to be sitting in a spreadsheet.
After you choose the inputs, the model estimates coefficients that you can read in plain business terms.
Coefficients, Baseline Demand, and Error Terms
The intercept, also called baseline demand, is the estimated outcome when predictors are zero or set to their reference values. For example, it might show roughly $25,000 in weekly revenue coming from organic traffic and existing customers before any paid spend is added.
A coefficient tells you how much the forecast changes when one input changes while the others stay the same. Say the coefficient on paid search spend is 4.0. In plain English, that means a $1,000 increase in weekly Google Ads spend is linked to a $4,000 increase in weekly revenue, all else equal.
The error term is the gap between what the model predicted and what actually happened. That gap points to change the model didn’t explain, like a missing variable or a one-off event it couldn’t see coming.
Put together, these parts help you build the forecast and make sense of what it’s telling you.
| Component | What It Represents | Marketing Example |
|---|---|---|
| Dependent variable | The forecast target | Weekly online revenue in USD |
| Independent variables | Measurable drivers of demand | Paid search spend, Black Friday indicator, discount % |
| Intercept | Baseline demand when predictors are zero or at their reference values | ~$25,000/week from organic traffic and existing customers |
| Coefficient | Effect of one driver, all else equal | +$4,000 revenue per $1,000 increase in paid search spend |
| Error term | Unexplained change | One-off events the model could not anticipate |
How to Build a Multiple Regression Forecast for Marketing
Define the Forecast Goal and Gather the Right Data
Once you know the outcome you want to predict and the drivers behind it, the next job is to turn that into a dataset you can actually forecast with. Start with the business decision the forecast needs to support, like weekly orders, monthly leads, or revenue at different spend levels.
For most small businesses, weekly forecasts make the most sense. They smooth out day-to-day noise but still give you enough detail to adjust campaigns and plan inventory. Monthly forecasts tend to fit longer sales cycles better, like high-ticket services or B2B deals, where quarterly budget calls matter more than weekly ups and downs.
After that, gather at least 24–36 months of historical data from ad platforms, analytics tools, CRM systems, sales records, and pricing or promotion logs. Build the dataset so each row represents one time period, with the outcome and every driver lined up to that same week or month.
With the goal locked in, clean and align the data before you build the model.
Prepare the Data and Choose Model Variables
Data from different platforms almost never lines up neatly. First, bring every source to the same time period. If you’re forecasting weekly, aggregate everything to that same weekly window so each row covers the same Monday–Sunday range. Use one time format and one currency format across all sources.
Then deal with missing values based on why they’re missing. Keep actual business spikes. Don’t treat promotions like random noise. If campaigns were paused, set spend to $0. If you have small random gaps, use carry-forward or interpolation. And if promotions caused spikes, keep those spikes and add a promotion flag so the model can learn that effect.
A few engineered variables can make a big difference in marketing forecasts:
- Holiday indicators, like
thanksgiving_week = 1for the week that includes Thanksgiving, help catch demand shifts that spend data alone won’t show - Lagged spend helps model delayed conversion effects
- Rolling averages help show the underlying trend
Stick with a small set of predictors tied to how the business works instead of dumping in every metric you can find.
After the dataset is clean, fit the model and turn the output into plain business language.
Fit the Model and Read the Results in Business Terms
You can fit the model in Excel, Python, or R, then review the coefficients, p-values, and R-squared. The point isn’t just to get a tidy statistical result. The point is to build a forecast you can use for spend, pricing, and inventory calls.
Each output should be read as a business statement. A coefficient shows how much the outcome changes when one driver changes, with everything else held steady. Low p-values suggest the relationship is less likely to be random noise. R-squared shows how much of the variation the model explains. So if the model has an R-squared of 0.85, it explains 85% of the variance in weekly sales based on inputs like media spend, promotions, and seasonality.
Before using the forecast for planning, test it on holdout data. Then use what you learn to compare budget and channel scenarios before you commit spend.
sbb-itb-2ec70df
How to Validate Forecasts and Use Them in Marketing Planning
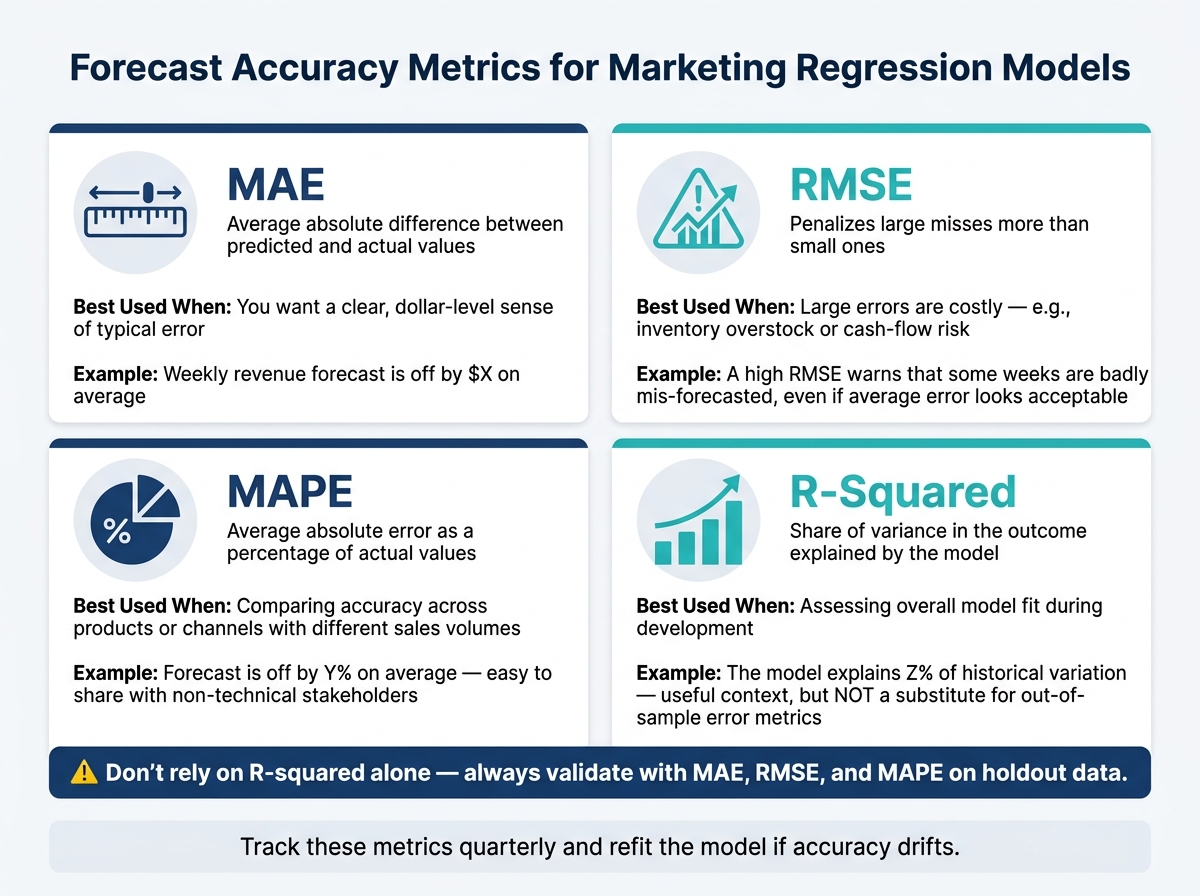
Forecast Accuracy Metrics: MAE vs RMSE vs MAPE vs R-Squared
Check Accuracy With Historical Holdout Data
Once the model is fit, test it on data it hasn’t seen yet before you use it for planning. The standard method is a chronological train/test split: train on earlier periods, hold out the most recent weeks, then score that holdout period by comparing predicted weekly revenue with actual sales.
For a small U.S. business with two years of weekly data, train on the first 70% to 80% of periods. Then predict the holdout window and check error with MAE, RMSE, MAPE, and R-squared. That gives you a plain business view of how far off the model is.
Only use the model if holdout error is low enough for the planning decision you’re making. If it misses a key period by a lot, pause and dig into the cause before you commit budget.
The big idea here is simple: judge models by out-of-sample performance, not in-sample R-squared. A model can line up nicely with past data and still do a poor job predicting what comes next.
Also, don’t shuffle rows at random when you split marketing data. Time order matters. Random splits can break chronology and make the model look better than it is.
Once the model clears the holdout test, it stops being just a statistical exercise. It becomes something you can use for planning.
Use Forecasts for Budgeting and What-If Scenarios
If holdout accuracy looks acceptable, use the model to compare budget and pricing scenarios. Start with the intercept and non-marketing drivers to estimate baseline demand. Then adjust the forecast with the coefficients for spend, price, and promotions.
This is where regression forecasts start to pay off. Say the model includes a price variable and a paid social coefficient. You can test a 10% price drop – from $100 to $90 on a core product – and estimate the change in weekly units sold and total revenue. You can also model what happens if you add $2,500/month to paid social.
If the paid social coefficient suggests that each extra $1 in paid social brings in $1.80 in revenue, that bump points to about $4,500 in added monthly revenue. From there, you weigh the forecast against your margins and cash flow to see if the move holds up.
Forecast Accuracy Metrics: A Comparison Table
Each accuracy metric tells you something different. Using only R-squared isn’t enough. A model can explain a lot of past variance and still miss peak weeks by a mile. The table below shows when each metric helps most and how to read it in plain business terms.
| Metric | What It Measures | Best Used When | How to Interpret It |
|---|---|---|---|
| MAE (Mean Absolute Error) | Average absolute difference between predicted and actual values | You want a clear, dollar-level sense of typical error | Weekly revenue forecast is off by $X on average |
| RMSE (Root Mean Squared Error) | Square root of average squared errors; penalizes large misses more | Large errors are costly, such as inventory overstock or cash-flow risk | A high RMSE warns that some weeks are badly mis-forecasted, even if average error looks acceptable |
| MAPE (Mean Absolute Percentage Error) | Average absolute error as a percentage of actual values | Comparing accuracy across products or channels with different sales volumes | Forecast is off by Y% on average, which is easy to share with non-technical stakeholders |
| R-squared | Share of variance in the outcome explained by the model | Assessing overall model fit during development | The model explains Z% of historical variation – useful context, but not a substitute for out-of-sample error metrics |
Track these metrics every quarter and refit the model if accuracy starts to drift as market conditions change.
Strengths, Limitations, and Key Takeaways
Where Multiple Regression Works Best
After validation, the next step is simple: figure out when multiple regression is worth trusting.
Multiple regression is useful in marketing forecasting because it looks at several demand drivers at the same time. Instead of guessing which factor mattered most, you can estimate how each one connects to revenue or demand. That makes budget choices more precise.
It tends to work best for established products with 24+ months of clean, aligned historical data across channels. When those conditions are in place, the model can produce clear coefficients you can turn into business decisions. For example, you can estimate incremental revenue from each extra $1 spent on search, social, or trade promotions. It also helps with scenario planning, so you can test what may happen if you move $50,000 from one channel to another.
Common Problems to Watch For
The biggest risks are multicollinearity, overfitting, and weak data quality.
Multicollinearity shows up a lot in marketing because channels often move together. Meta and Instagram spend, for instance, may rise and fall in sync. When that happens, the model has a harder time separating their individual effects. The result? Coefficients can get shaky, which makes them less useful for budget calls.
Overfitting is the other big trap. A model can look strong on past data and still fall apart on new data if it learned noise instead of actual demand patterns. The usual fix is to keep the number of predictors in line with the amount of data you have and test the model on holdout periods.
These limits shape how much confidence you should place in the forecast.
| Strength | Limitation |
|---|---|
| Measures multiple demand drivers at the same time | Coefficients can become unstable when channels are highly correlated (multicollinearity) |
| Produces interpretable coefficients for budgeting | Assumes relationships are roughly linear; can miss saturation and threshold effects |
| Supports what-if scenario planning | Depends on stable history; can weaken during shocks or major market shifts |
| Uses a well-known statistical base; easier to explain to non-technical stakeholders | Higher risk of overfitting when model complexity outpaces available data |
| Turns coefficients into dollar-based budget choices | Missing, noisy, or misaligned inputs can distort results |
There’s one more issue to watch: nonlinear response patterns. Media channels often deliver diminishing returns as spend climbs. A straight-line model won’t catch that saturation point. In those cases, log terms or segment-based terms can do a better job.
Conclusion: What Business Owners Should Take Away
Multiple regression gives business owners a structured way to connect sales or revenue with the marketing and external factors driving them. But the quality of the forecast depends on clean inputs, clear goals, holdout validation, and regular model updates.
Use multiple regression when demand has clear drivers, a stable history, and enough data to test the model.
FAQs
How much data do I need for a reliable model?
It depends on the method you use and what you’re trying to predict.
For time series analysis, a good rule of thumb is 2 to 3 years of monthly sales data. That usually gives you enough history to spot seasonality, trends, and repeat patterns without guessing in the dark.
For ROI analysis or other campaign reviews, you’ll want 24 months of detailed daily data. Daily granularity matters here because campaign performance can shift fast, and monthly rollups often hide what’s going on.
Model choice also comes down to the size and shape of your dataset. If you’re working with a large dataset that has complex, non-linear patterns, deep learning models like LSTM are often the best fit. If your dataset is smaller, simpler statistical models tend to work better and are less likely to overfit.
What should I do if my marketing channels move together?
If your marketing channels tend to move in sync, you’re probably dealing with multicollinearity. That simply means your independent variables are closely correlated, which makes it harder for the model to tell how much each channel is driving demand on its own.
To deal with it, keep your data clean and consistent. Review your data storage on a regular basis, and tighten up your collection process so each variable contributes its own relevant signal to the forecast.
When should I update or rebuild the forecast?
Update or rebuild your forecast when new data comes in so it stays accurate and useful. Forecasting isn’t a one-and-done task. It works best as a steady process, with regular checks to make sure the model still fits what’s happening now.
You’ll want to retrain or adjust the model when:
- error metrics go past your accepted limits
- you spot model drift
- major internal or external changes hit the business, like a new product launch or shifts in the economy