If I want stakeholders to back content, I need to show one thing: how content turns spend into revenue. Traffic and shares are fine for context, but budget decisions usually come down to revenue, profit, ROI, cost per lead, and payback period.
Here’s the short version:
- I start with a simple formula: ROI = ((revenue from content – content cost) / content cost) x 100
- I track the full path from traffic -> leads -> opportunities -> closed revenue
- I separate content-sourced from content-influenced results
- I use attribution that fits the sales cycle, not just the easiest model
- I include all costs: labor, tools, freelancers, SEO, and promotion
- I report different angles to executives, finance, and sales
- I call out data gaps instead of hiding them
A simple example makes the point fast: if a team spends $25,000 on content and ties that work to $80,000 in closed-won revenue, that’s 220% ROI. That’s the kind of number stakeholders can use.
A few stats also explain why this is hard: 56% of B2B marketers struggle to attribute ROI to content, and 47% do not measure content ROI at all. So if this feels messy, that’s normal.
What matters most is this: I don’t need more metrics. I need the right ones, clean tracking, and a report that answers whether content is worth the money.
Define Content ROI and Pick Metrics That Matter
Use a Clear ROI Formula and Account for All Content Costs
Content ROI compares the revenue tied to content with the total cost of making and promoting that content. The standard formula is:
ROI (%) = [(Revenue attributed to content − Cost of content) / Cost of content] × 100
Here’s a simple example. If your content program cost $10,000 in one month and brought in $45,000 in attributed revenue, your ROI is 350% – or about $3.50 in net return for every $1 spent. That’s the kind of number people can use in a budget review without squinting at a spreadsheet.
Where teams slip up is usually the cost side. If you want a number people will trust, include every major expense tied to content:
- Strategy
- Production
- SEO
- Research
- Tools
- Freelancers or agencies
- Paid distribution
If you leave out internal labor hours or tool subscriptions, the ROI looks better than it should. And once Finance or leadership spots that gap, your number loses weight.
After the formula is locked in, the next job is picking the small set of metrics that show whether content is pushing revenue forward.
Track Funnel Metrics That Connect to Revenue
Most stakeholders don’t care much about traffic by itself. They care about whether content helps build pipeline and bring in revenue. So the metrics that matter are the ones that show movement through the funnel – from traffic, to conversion, to pipeline, to revenue.
| Funnel Stage | Metrics to Track |
|---|---|
| Top (Awareness) | Organic sessions, search impressions, click-through rate |
| Middle (Engagement) | Gated content downloads, email sign-ups, scroll depth |
| Bottom (Conversion) | Content-sourced leads, conversion rate, cost per lead |
| Pipeline | Influenced opportunities, sales-qualified leads, pipeline value |
| Revenue | Closed-won revenue from content-driven touchpoints, ROI % |
There are also two terms that need clear labels. Content-sourced means content was the first touch. Content-influenced means content showed up somewhere in the buyer journey before the deal closed. Both matter. They just answer different questions, so don’t lump them together and hope nobody notices.
Vanity Metrics vs. ROI Metrics: What to Report and What to Drop
Content ROI is about business impact, not just attention. Page views, impressions, likes, and followers can show that people noticed something. But attention alone doesn’t tell you whether to expand, cut, or shift budget.
That’s the filter to use: does this metric help someone make a budget decision? If not, it shouldn’t lead the report.
Not every metric belongs in the ROI story. The ones worth leading with are the ones tied to pipeline or revenue. A post with 1,000 visits, 40 leads, and $20,000 in influenced opportunities beats one with 10,000 visits and no leads. Every time.
| Metric | Meaning | Stakeholder Relevance | Use in Report |
|---|---|---|---|
| Page views / impressions | Raw traffic volume | Low – doesn’t indicate revenue | Drop from the lead narrative |
| Social likes / followers | Brand attention | Low for Finance and Sales | Secondary or omit entirely |
| Organic sessions | Traffic from organic search | Medium – useful as context | Supporting metric |
| Conversion rate | % of visitors who take action | High – shows content effectiveness | Include |
| Content-sourced leads | Leads where content was the first touch | High for Sales and Marketing | Include |
| Cost per lead | Efficiency of content spend | High for Finance | Include |
| Influenced pipeline value | Deals where content touched the journey | High for Sales and Executives | Include |
| Attributed revenue / ROI % | Direct financial return | Essential for all stakeholders | Lead with this |
A good rule here: pair every volume metric with a value metric. Traffic without conversion rate doesn’t say much. Leads without pipeline value don’t either. You need both parts of the picture if you want the report to hold up.
Content Marketing ROI: Prove the Value of Your Content Strategy Before You Spend a $ w/ Alex Birkett
Connect Content to Revenue with Attribution and Clean Data
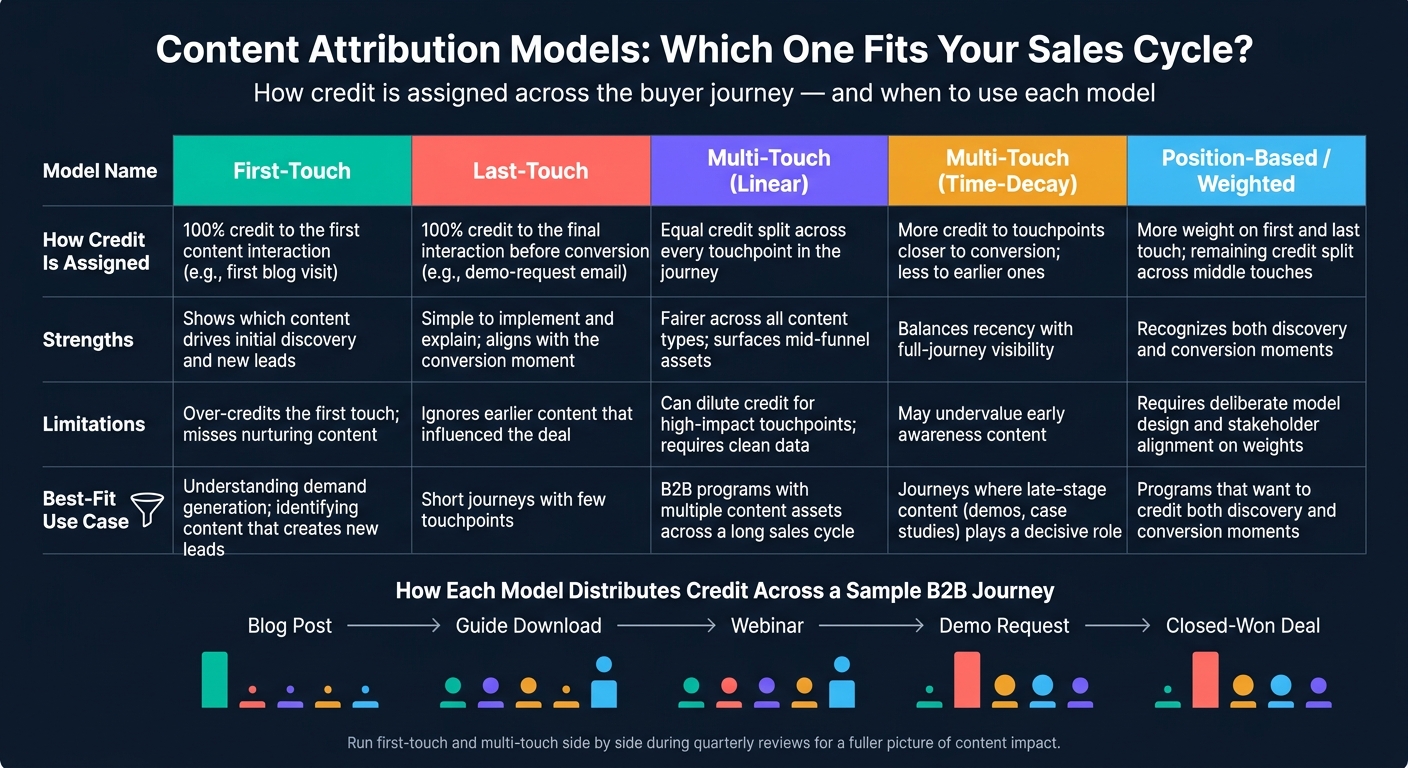
Content Attribution Models Compared: Which One Fits Your Sales Cycle?
Pick an Attribution Model That Fits Your Sales Cycle
Use the attribution model that lines up with how people actually buy.
For short paths with only a few touchpoints, last-touch attribution can work well. But in complex B2B sales cycles, it often tells a narrow story. A prospect might read a blog post in January, download a guide in February, attend a webinar in March, and sign a contract later. Last-touch gives all the credit to the final click before conversion, which means earlier content can disappear from the report even if it helped push the deal along.
Multi-touch attribution spreads credit across the touchpoints that shaped the deal. For most content programs, that makes more sense. Blog posts, guides, and case studies usually don’t close deals by themselves.
Once you choose the model, the next job is simple: collect the right data at each touchpoint.
The Minimum Tracking Setup You Need
You don’t need a huge tech stack to start. You do need a few pieces working together the same way every time.
UTM parameters label every link you share in emails, social posts, paid campaigns, and content promotion. That’s how you trace revenue back to a specific asset. Stick to lowercase and use one naming system, like utm_source=linkedin, utm_medium=organic, and utm_campaign=2026_q3_content_roi_guide. A single typo or capitalization mismatch can split your data into separate records and make reporting look shaky.
Web analytics should track actions that mean something: scroll depth on key blog posts, CTA clicks, form submissions for gated content, and webinar sign-ups. Session counts on their own won’t show which content is driving qualified action.
Form tracking ties content engagement to lead capture. Track newsletter sign-ups, content downloads, demo requests, and contact forms as conversion events so you can connect assets to leads.
CRM integration is where the ROI story gets finished. When someone fills out a form, the original content source and campaign data should flow straight into your CRM. That lets you tie a closed-won deal back to the content that started the conversation.
Cost tracking finishes the loop. Record production costs like writer fees, design, in-house time, and tools, along with promotion spend, at the asset or campaign level. Without that, your ROI formula has a gap in it, and Finance will spot it fast.
First-Touch, Last-Touch, and Multi-Touch Attribution: A Side-by-Side Comparison
Each model tells a different part of the story. The table below shows how they differ and when each one makes the most sense for content ROI reporting.
| Attribution Model | How Credit Is Assigned | Strengths | Limitations for Content ROI | Best-Fit Use Case |
|---|---|---|---|---|
| First-Touch | 100% of revenue credit goes to the first content interaction (e.g., the first blog visit) | Shows which content drives initial discovery and new leads | Over-credits the first touch and misses nurturing | Understanding demand generation and identifying which content creates new leads |
| Last-Touch | 100% of credit goes to the final interaction before conversion (e.g., a demo-request email) | Simple to implement and explain; aligns with the moment of conversion | Ignores earlier content that influenced the deal | Short journeys with few touchpoints |
| Multi-Touch (Linear) | Equal credit split across every touchpoint in the journey | Fairer across all content types; surfaces mid-funnel assets | Can dilute credit for high-impact touchpoints; requires clean data | B2B programs where multiple content assets contribute across a long sales cycle |
| Multi-Touch (Time-Decay) | More credit to touchpoints closer to conversion; less to earlier ones | Balances recency with full-journey visibility | May still undervalue early awareness content | Journeys where late-stage content, such as demos and case studies, plays a decisive role |
| Multi-Touch (Position-Based / Weighted) | More weight on first and last touch; remaining credit split across middle touches | Recognizes both discovery and conversion moments | Requires deliberate model design and stakeholder alignment on weights | Programs that want to credit both discovery and conversion moments |
That model only helps if your tracking is clean, complete, and passed into your CRM.
Run first-touch and multi-touch side by side during quarterly reviews. This gives stakeholders a better view of how different content types help at different stages, instead of asking one number to explain a messy buying journey. Different models answer different budget questions, so pick the one that fits the decision in front of you.
Once attribution is set up, the next step is turning the data into a dashboard stakeholders can read in seconds.
sbb-itb-2ec70df
Build Dashboards and Reports Stakeholders Can Read at a Glance
Once attribution data is flowing into your CRM, the job gets simpler: show only the numbers that answer one question – is content worth the budget? Then use those same numbers in slightly different ways for executives, finance, and sales.
How to Structure a Simple Content ROI Dashboard
Keep the dashboard tight. Focus on a small group of core metrics:
- content-sourced leads
- influenced pipeline ($)
- influenced revenue ($)
- total content spend ($)
- cost per lead (CPL)
- cost per opportunity (CPO)
- ROI %
Put the main KPIs in a row of tiles at the top so people see the big picture right away. Under that, add two trend charts: one for monthly content spend vs. influenced revenue, and one for ROI % across the last six to twelve months. Use consistent date and currency formatting throughout.
A Q2 2026 summary tile might read: Content ROI: 200%. Influenced revenue: $120,000. Total spend: $40,000. That gives executives the answer fast. Is content paying back? Yes or no.
Keep the main dashboard to five to seven visuals. Anything more starts to feel like clutter.
Use this dashboard as the base view for every audience-specific report.
How to Adjust Your Report for Executives, Finance, and Sales
The data stays the same. What changes is the angle. Executives want the headline. Finance wants the math. Sales wants to know what moves deals.
| Audience | Primary Focus | What to Emphasize |
|---|---|---|
| Executives (CEO, CMO) | ROI %, revenue impact, budget efficiency | One-page summary: KPI tiles, 1–2 trend charts, short narrative |
| Finance (CFO, FP&A) | Cost allocation, unit economics, forecastability | Spend breakdown by category, CPL, CPO, revenue per lead |
| Sales leadership (VP Sales) | Pipeline quality, deal velocity, win rates | Content that shortens the sales cycle or improves close rates |
For finance, break spend into categories like creation, promotion, tools, and agency costs. Then add side-by-side comparisons that make efficiency plain to see. For example, a content CPL of $50 versus a paid search CPL of $120 says a lot without extra commentary.
For sales leadership, bring forward the assets tied to faster closes or better win rates. If prospects who viewed a certain case study closed 15 days faster on average, that should be front and center in the sales report.
Show Top-Performing Assets in a Budget Decision Table
An asset-level summary is often the clearest way to show where next quarter’s budget should go. Skip vanity metrics like pageviews or social shares. Stick with numbers tied to revenue decisions.
| Asset Name | Content Type | Leads Generated | Pipeline Influenced ($) | Revenue Influenced ($) | ROI % |
|---|---|---|---|---|---|
| 2026 B2B SaaS ROI Guide | Blog | 350 | $280,000 | $95,000 | 158% |
In practice, this table should cover your top five content assets by influenced revenue and opportunities. That makes budget talks much more concrete. If someone asks whether to put more money into webinars or case studies, you shouldn’t need a long debate. The table should make the call pretty clear.
Present the ROI Story Clearly and Close with Next Steps
Walk Stakeholders Through the Numbers: From Spend to Revenue
After the dashboard, turn the data into a decision. The simplest way to present content ROI is as a straight line: spend → output → outcome → revenue. That mirrors how executives and finance teams look at an investment.
Use the same ROI, pipeline, and revenue numbers shown in your dashboard. Start with total content spend for the period – for example, $150,000 in Q2 2026. Then tie that spend to the initiatives behind it. Next, move through the funnel: how many MQLs, SQLs, opportunities, and how much pipeline those efforts produced. Then land on the business result: closed-won revenue influenced by content, plus the ROI percentage.
Don’t stop at a single snapshot. Show movement across periods. That’s what gives the numbers weight. For example, content-influenced pipeline grew from $2,100,000 in Q1 to $3,250,000 in Q2 – up 55%. End by stating the budget shift you recommend. And if the data isn’t complete, say that plainly before you make the recommendation.
How to Address Data Gaps Without Losing Credibility
Call out known gaps early. That makes the case stronger, not weaker.
Be clear about what the numbers measure and what they miss. Maybe your figures don’t include content used in sales calls when reps share whitepapers offline. If so, say it. That tells stakeholders the ROI figures are probably conservative. Then pair each gap with a clear plan to fix it. That shows the team is getting better at measurement, not dodging the issue.
| Measurement Area | Current Strength | Current Limitation | Planned Improvement |
|---|---|---|---|
| Multi-touch attribution | Digital web and email interactions tracked; CRM integrated | Early-funnel content undervalued; limited cross-channel visibility | Implement W-shaped or time-decay model; align rules with finance |
| Sales enablement content usage | Sales library available to reps | Minimal data on which assets are used in active deals | Add CRM fields for content used in opportunity; train reps to log usage |
| Lead source & campaign attribution | UTM tracking on major campaigns; CRM source field populated | Inconsistent UTM usage; hard to distinguish content-sourced vs. content-influenced | Standardize UTM conventions; introduce content touch flags in CRM |
| Data quality & governance | Central CRM and marketing automation used across teams | Duplicate records, missing fields, inconsistent opportunity stages | Quarterly data quality reviews; governance rules for mandatory fields |
Once those limits are on the table, close with the budget decision you want stakeholders to make.
Conclusion: What a Strong Content ROI Case Includes
A strong content ROI case is clear, financial, and honest: ROI defined, revenue tracked, attribution explained, and gaps named.
That mix – financial framing, clean attribution, audience-specific reporting, and plainspoken storytelling – is what helps move a content program from a cost center to a business investment teams can defend.
For help with analytics, dashboards, and performance reporting, Growth-onomics supports teams with data-driven growth services.
FAQs
How long does it usually take to prove content ROI?
Content ROI usually takes more time to show up than other marketing work because the payoff builds bit by bit. A blog post, guide, or landing page might not do much in its first few weeks. Then, a few months later, it starts pulling in traffic, leads, and sales.
That’s why short-term snapshots can give you the wrong read. Instead of judging performance week by week or month by month, track it over 3, 6, or 12 months.
Sales cycles can slow things down too, especially in B2B. Someone might read a piece of content today, join a demo next month, and sign a deal much later. If you measure too early, it’s easy to miss that connection and make the wrong call. Use attribution windows that match how long your buyers usually take to convert.
What if my CRM data is incomplete or inaccurate?
If your CRM data is incomplete or inaccurate, set up closed-loop reporting by connecting your analytics, CRM, and payment systems. That way, data moves through your marketing stack in one steady flow instead of getting lost between tools.
To tighten up accuracy, use consistent UTM parameters, lean on native integrations where you can, and think about a Customer Data Platform to bring customer journey data into one place. This can help cut down on gaps caused by siloed information.
Should I report sourced ROI and influenced ROI separately?
Yes. Reporting them separately gives a fuller view of marketing performance.
Sourced ROI covers revenue tied straight to your content. Influenced ROI looks at touchpoints that helped lead to a conversion across a more complex buyer journey.
That split matters because most buyers don’t convert after just one interaction. They might read a blog post, click an email, visit a landing page, and come back later through search or paid ads. When you report these metrics separately, it becomes easier to show how content contributes at different stages of the funnel.