Tag-based clickstream data is a powerful way to track and analyze user behavior online. By using JavaScript snippets or tag management systems like Google Tag Manager, businesses can record detailed user interactions in real time. Unlike basic pageview tracking, this method provides insights into specific actions such as button clicks, scroll depth, and repeated interactions with non-interactive elements, which can highlight UX issues.
Key Applications:
- Customer Journey Mapping: Identify "golden paths" leading to conversions and detect churn signals early.
- Real-Time Personalization: Use live user data to deliver instant, tailored experiences.
- Marketing Attribution: Recover lost conversion data using server-side tagging to improve ad performance.
- Product Analytics: Focus on user behavior to refine features and fix UI issues.
- Retention and LTV Modeling: Spot churn risks and prioritize high-value customers for retention efforts.
- E-Commerce Optimization: Analyze checkout steps to reduce cart abandonment.
- Cross-Device Analysis: Track users across devices for a complete journey view.
- Predictive Analytics: Use click patterns to forecast user actions and improve decision-making.
The article dives into how businesses can use this data to improve performance, increase revenue, and make smarter decisions.
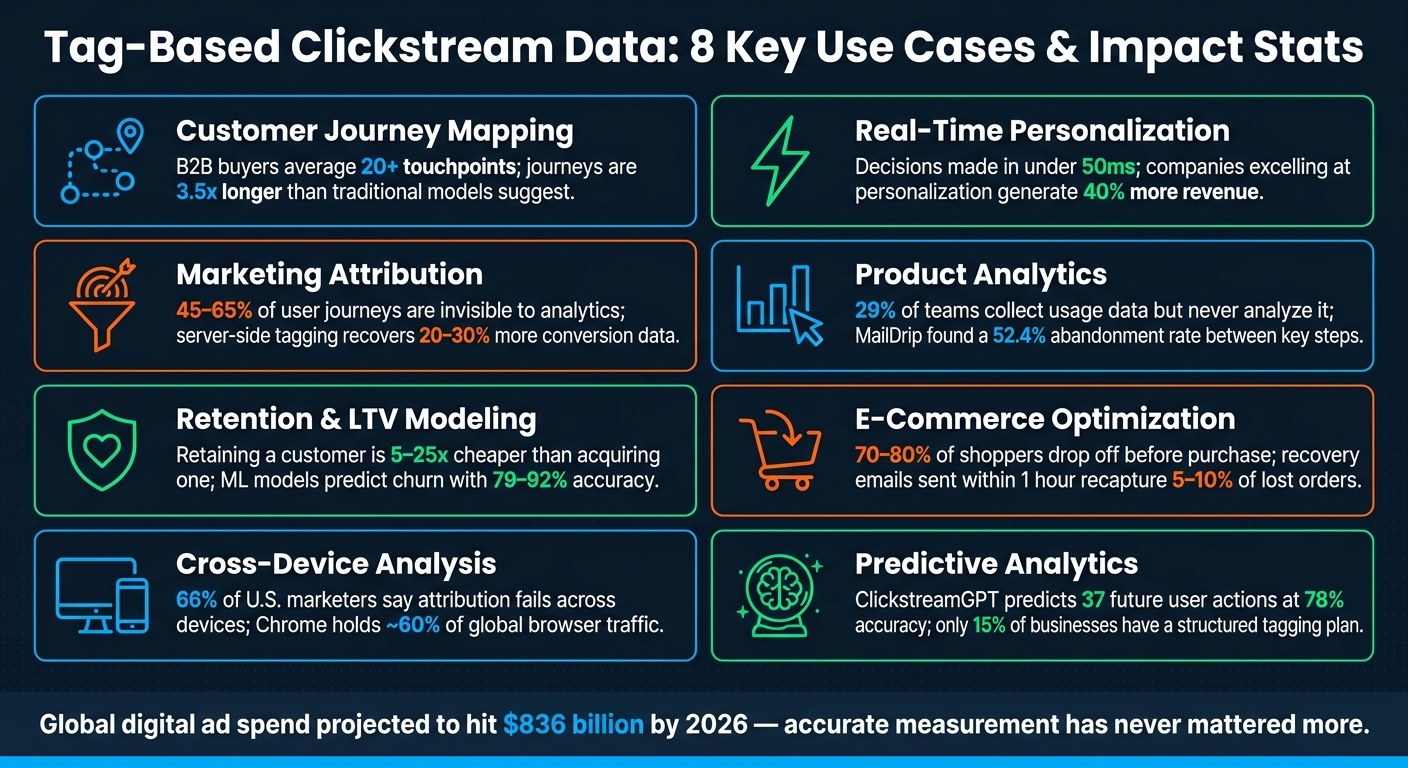
Tag-Based Clickstream Data: 8 Key Use Cases & Impact Stats
Clickstream Analytics
sbb-itb-2ec70df
1. Customer Journey Mapping
Tag-based clickstream data takes the guesswork out of understanding customer behavior by capturing real actions instead of relying on idealized models. This approach reveals the complexity of user journeys, including backtracking, lateral moves, and channel switching – details that traditional analytics often miss.
One powerful use of this data is uncovering "golden paths" – the sequences of touchpoints that consistently lead to valuable conversions. For example, you might find that a journey like blog visit → webinar registration → pricing page strongly predicts purchase intent. Once these patterns are identified, marketers can focus their budgets on amplifying these high-performing paths.
Identity resolution plays a key role here, linking anonymous cookies to identifiers like emails or user IDs across devices. This creates a unified timeline of customer interactions. On average, a B2B buyer engages with more than 20 touchpoints before converting, and their journeys are often 3.5 times longer than what traditional attribution models suggest.
"Customer journey analytics connects every touchpoint (marketing, product, sales, support) into a single person-level timeline, replacing idealized funnel models with actual behavior data." – OSCOM.ai
Clickstream data also helps detect churn signals in post-purchase behavior. For instance, patterns like reduced login frequency or limited feature usage often emerge 60–90 days before a customer cancels. This gives teams an opportunity to step in and address issues before it’s too late. Services like Growth-onomics leverage these insights through Customer Journey Mapping to help businesses act on behavioral data proactively. This detailed understanding of customer behavior is a foundation for real-time personalization, which we’ll cover next.
2. Real-Time Personalization
Behavior-Triggered Personalization at Scale
Tag-based clickstream data allows brands to respond instantly to user intent. By using JavaScript tags and SDKs, live events are captured along with session details, device type, and geolocation data. This information feeds into a decision engine, which analyzes real-time signals against historical patterns to determine the most effective next step – whether that’s a dynamic banner, a push notification, or an email with live content blocks that update when opened. This immediate data capture makes real-time decision-making possible.
Thanks to edge computing, decisions are made in under 50 milliseconds, seizing fleeting high-intent moments. These split-second actions can lead to noticeable boosts in user engagement.
Here’s a real-world example: In March 2026, Mobile Premier League (MPL), a mobile gaming platform, tackled a 14-minute delay in notification delivery. By pre-computing user segments and triggering actions based on live events (like a cricket toss), MPL managed to send nearly 10 million messages within a minute of the event. This approach led to a 20%–30% increase in click-through rates and a 5% rise in conversions.
"The brands winning on personalization aren’t necessarily the ones with the biggest budgets. They’re the ones that closed the gap between when user intent forms and when the experience reflects it." – CleverTap
The business impact is striking: companies that excel in personalization generate 40% more revenue from these efforts compared to their competitors. Such agility also supports advanced marketing attribution and deeper analytics.
3. Marketing Attribution
Recovering Conversion Signal
Standard client-side pixels are falling short, leaving a large portion of user journeys untracked. In fact, 45% to 65% of these journeys are invisible to analytics platforms due to cookie consent banners and browser restrictions. This creates a major gap, leading to skewed budget decisions.
Server-side tagging offers a solution by sending conversion events directly through APIs like Meta’s Conversions API or Google Enhanced Conversions. This approach bypasses ad blockers and browser restrictions, recovering around 20–30% more conversion data.
For example, using Meta’s Conversions API alongside standard pixels has been shown to reduce cost per result by an average of 17.8%. Additionally, when Elevar implemented server-side tagging, a Meta event match quality score jumped from 5.8 to 8.2 in just three weeks.
"When we switched to server-side with Elevar, our Meta event match quality score went from a 5.8 to an 8.2 in three weeks. Our CPAs didn’t change – but suddenly the algorithm had enough signal to actually optimize." – Amanda Goetz, Advisor
This improvement is crucial because ad platform algorithms rely heavily on match quality to optimize ad delivery. By passing hashed first-party identifiers – such as email addresses and phone numbers – along with each purchase event, these algorithms gain the necessary data to target the right audience, not just the trackable one.
4. Product Analytics
Turning Clicks Into Product Decisions
Product analytics takes the raw data from user interactions and transforms it into actionable insights for improving design and functionality. While 38% of product teams effectively gather usage data, a surprising 29% collect it but never analyze it – leaving valuable insights untapped. By using tag-based clickstream data, teams can go beyond general interaction statistics and focus on specific user behaviors that reveal what’s working and what needs attention.
By labeling interactions – like button clicks, form submissions, or menu selections – as named events, teams can track meaningful actions. For example, instead of vague data about clicks, you might track events like "Started Checkout" or "Created Invoice." This approach helps pinpoint which features users engage with and which are ignored, offering clear guidance for product improvements.
Take MailDrip, an email marketing SaaS, as an example. In May 2026, the company implemented GA4 and GTM using a [feature]-[action] naming system (e.g., GA4-landing_page-create_new). This revealed a 52.4% abandonment rate between the "Create Email Next" and "Create Email Done" steps, highlighting technical and UI issues during the final submission stage.
Another example is Liv-ex, a fine wine trading platform. Using event labeling and path analysis, Product Manager Fred Haselton’s team discovered users were being unnecessarily routed through an extra results page before reaching wine detail pages. This insight led to an interface redesign that streamlined navigation.
"Understanding how users move around has led to us ripping up the current designs and creating something brand new." – Fred Haselton, Product Manager, Liv-ex
Beyond tracking workflows, tagging also uncovers "dead clicks" – repeated clicks on non-interactive elements. These patterns highlight misleading UI elements or areas where users expect functionality that doesn’t exist.
5. Retention and LTV Modeling
Forecasting Retention and LTV
Tag-based clickstream data offers a powerful way to monitor customer behavior in real time. By analyzing patterns like reduced session frequency, decreased feature usage, or visits to pages related to cancellations or downgrades, businesses can spot early warning signs of churn. This is critical because keeping an existing customer is far more cost-effective – studies show it’s 5 to 25 times less expensive than acquiring a new one.
One of the most effective tools for tackling churn is the Churn × LTV Priority Matrix. This framework categorizes customers based on their likelihood of leaving and their potential value. For example, high-value customers showing signs of churn can receive immediate, personalized attention, such as tailored offers or direct outreach. Meanwhile, lower-value customers at risk can be targeted with automated win-back campaigns. This ensures retention efforts are focused where they’ll have the biggest impact.
"The churn-LTV matrix transforms retention from a reactive process (noticing a cancellation after it happens) into a proactive one (intervening during the session where churn behavior first appears)." – ClickStream
Here’s a real-world example: In early 2026, a SaaS CRM platform with 3,200 customers implemented a churn prediction model. It flagged 180 users as having a 75% or higher likelihood of leaving. The customer success team acted quickly, offering solutions like feature customization or pricing adjustments. As a result, they retained 63 customers, protecting $118,000 in annual revenue.
Clickstream data doesn’t just help with churn – it also sharpens LTV (lifetime value) analysis. By tracking trends like purchase frequency, average order value growth, and browsing across product categories, businesses can identify their most valuable customers. These “whale” customers often score between 76 and 100 on a projected LTV index. Using machine learning models like XGBoost or Random Forest, businesses can predict churn with an accuracy of 79% to 92%. This allows for precise, data-driven retention strategies that go beyond guesswork, ensuring efforts are both efficient and effective.
6. E-Commerce Optimization
Reducing Cart Abandonment with Checkout Funnel Tagging
E-commerce businesses often lose 70–80% of potential customers between landing pages and final purchases. This drop-off represents a major revenue gap, but tag-based clickstream data offers a way to uncover where shoppers abandon the process.
By tagging each step in the checkout process with events – like view_cart, begin_checkout, add_shipping_info, and add_payment_info – you can identify where users drop off. For instance, 34% of shoppers abandon their carts when forced to create an account, and late-displayed shipping costs can also cause frustration.
"Checkout abandonment is more actionable because these shoppers demonstrated real purchase intent." – Jonathan Harrington, Conversion & UX Insights
Here’s a breakdown of common friction points at each stage of checkout:
| Checkout Step | Event Tag | Common Friction Trigger |
|---|---|---|
| Cart Viewed | view_cart |
High shipping costs shown too late |
| Checkout Started | begin_checkout |
Forced account creation |
| Shipping Entered | add_shipping_info |
Limited delivery speed options |
| Payment Entered | add_payment_info |
Trust issues or limited payment methods |
| Order Review | purchase |
Final total exceeds expected amount |
Platforms can use these insights to take action, such as detecting idle sessions and sending recovery emails. Streaming SQL applied to clickstream data can identify idle carts within 15–60 minutes and trigger recovery emails. These emails, when sent within an hour, can recover 5–10% of lost orders.
Even small changes can make a difference. For example, each additional form field reduces checkout completion rates by about 7%. Improvements like enabling Apple Pay or showing shipping estimates earlier can go a long way in increasing conversions.
7. Cross-Device Analysis
Making Sense of Multi-Device Journeys
Today’s users rarely stick to one device when making a purchase. They might spot an item through a TikTok ad on their phone, dig deeper on a tablet, and finally complete the transaction on a desktop. Without a unified tracking system, these interactions can appear as if they’re coming from entirely different users, which throws off your data. That’s where tag-based clickstream data comes in. By using identity resolution, this method connects the dots between devices. It does this by matching known user identifiers like hashed emails (deterministic matching) and, when those aren’t available, relying on behavioral patterns (probabilistic matching). This kind of tracking ensures you’re not missing key insights or misattributing conversions, giving you a complete picture of the customer journey across devices.
"A click on a TikTok ad on mobile and a conversion via branded search on desktop are two separate records in most tracking setups." – Usermaven
Nearly two-thirds of U.S. marketers (66%) admit their attribution methods fall short when it comes to tracking users across devices. This gap often leads to wasted budgets, especially for mobile ads that spark interest but don’t get credit for later desktop purchases.
| Feature | Single-Device Tracking | Tag-Based Cross-Device Tracking |
|---|---|---|
| User Identity | Fragmented | Unified (linked to a single ID) |
| Conversion Credit | Inaccurately assigned | Deduplicated and accurately assigned |
| Journey Visibility | Single-session view | Full path from discovery to purchase |
| Data Source | Third-party cookies/platform pixels | First-party data/server-side tags |
With third-party cookies on their way out – particularly important since Chrome commands about 60% of global browser traffic – server-side tagging and first-party data strategies are becoming the go-to solutions. These methods not only support cross-device tracking but also align with the broader shift toward first-party data frameworks discussed throughout this article.
8. Predictive Analytics
Using Past Behavior to Anticipate Future Actions
Most analytics tools focus on analyzing past events. Predictive analytics, however, takes it a step further by using historical patterns to anticipate what users are likely to do next. This process is powered by tag-based clickstream data, which transforms detailed user interactions into actionable predictions.
Every tagged event – whether it’s a visit to the pricing page, a return session within 72 hours, or an abandoned checkout – provides behavioral insights that machine learning models can use. These signals, when pieced together, uncover intent patterns that traditional analytics might overlook.
From Click Patterns to Predictions
The most advanced systems treat click sequences similarly to how language models process words. Take ClickstreamGPT as an example: this Transformer-based model, trained on 100 million clickstream records, can predict up to 37 different future user actions with an average accuracy of 78%. Achieving this level of precision relies on capturing the sequence of events, not just isolated actions.
To make this work, it’s critical to collect event sequences rather than snapshots. Tags should record the order, recency, and frequency of interactions. For instance, a user who visits a pricing page twice and returns within 72 hours is a completely different prospect than one who views it once and leaves.
"Analytics maturity is not a dashboard problem, it is a tagging and modeling problem." – Clicker.cloud
Predictive analytics builds on concepts like real-time personalization and detailed attribution. By leveraging these granular signals, businesses can forecast user behavior and take action. For example, a high churn-risk score could trigger automated retention campaigns, while high-propensity leads might be routed directly to the sales team. However, success hinges on proper tagging. Tags must consistently capture key details like source, intent, and outcome; without this foundation, even the best algorithms won’t deliver reliable results.
Conclusion
Tag-based clickstream data plays a critical role in shaping data-driven decisions. From customer journey mapping to predictive analytics, one truth stands out: better data leads to better decisions.
What sets tag-based clickstream data apart is its ability to dynamically capture user intent. It reveals not just that someone visited a page, but what they did there and why it matters. With global digital ad spending projected to hit $836 billion by 2026, the stakes for accurate measurement have never been higher.
"In 2026, the real cost of digital marketing isn’t just the price of the click – it’s the revenue lost in this measurement gap." – Prateek Passi, Vovia
This shift in analytics reflects a clear evolution: descriptive, diagnostic, predictive, and finally, prescriptive analytics. Yet, only 15% of businesses have a structured tagging plan. For those ready to invest in robust tagging infrastructure, the potential rewards are immense.
If you’re tired of leaving revenue on the table, Growth-onomics is here to help. They specialize in data analytics, customer journey mapping, and performance marketing – creating tagging systems and measurement frameworks that turn clicks into measurable business results.
"If you don’t base your marketing campaign decisions on data, you’re just guessing." – Growth-onomics
FAQs
What should I tag first to get useful clickstream insights fast?
To get actionable insights quickly, focus on identifying your top 2–3 macro-conversions – such as demo requests or purchases – that have a direct effect on revenue. Align these events with the stages of your funnel before setting up tags. For quicker results, give priority to micro-conversions like starting a form or viewing a video. Setting a clear standard for event naming and requirements from the beginning helps ensure your data remains consistent, easy to interpret, and scalable for both descriptive and predictive analysis.
How does server-side tagging recover conversions lost to ad blockers and consent?
Server-side tagging shifts data collection from the browser to your own server, helping recover lost conversions. When a user triggers an event, the data is sent to your subdomain (like metrics.yourdomain.com), which makes it look like a core part of your website. This approach bypasses ad blockers and browser restrictions. The server then validates the data and sends it to advertising platforms through APIs, ensuring more precise conversion tracking and attribution.
How can I link users across devices without third-party cookies?
To connect users across devices without relying on third-party cookies, focus on first-party data strategies. One approach is deterministic tracking, which uses unique identifiers such as email addresses or account IDs collected from logins or forms. For users who remain anonymous, probabilistic matching can help by analyzing data like IP addresses, device types, and user behaviors to identify patterns. Additionally, server-side tracking offers a secure way to manage first-party cookies or internal IDs, helping you overcome many of the restrictions tied to browser-based tracking.