

Want to know if your ad costs are competitive? Benchmarking your Cost-Per-Click (CPC) is the key. CPC tells you how much you’re paying per ad click and whether your campaigns are efficient with expert performance marketing strategies. Here’s what you need to know:
- Why CPC Matters: It directly impacts your budget and profitability. A $2.50 CPC might be great for some industries but too high for others like e-commerce.
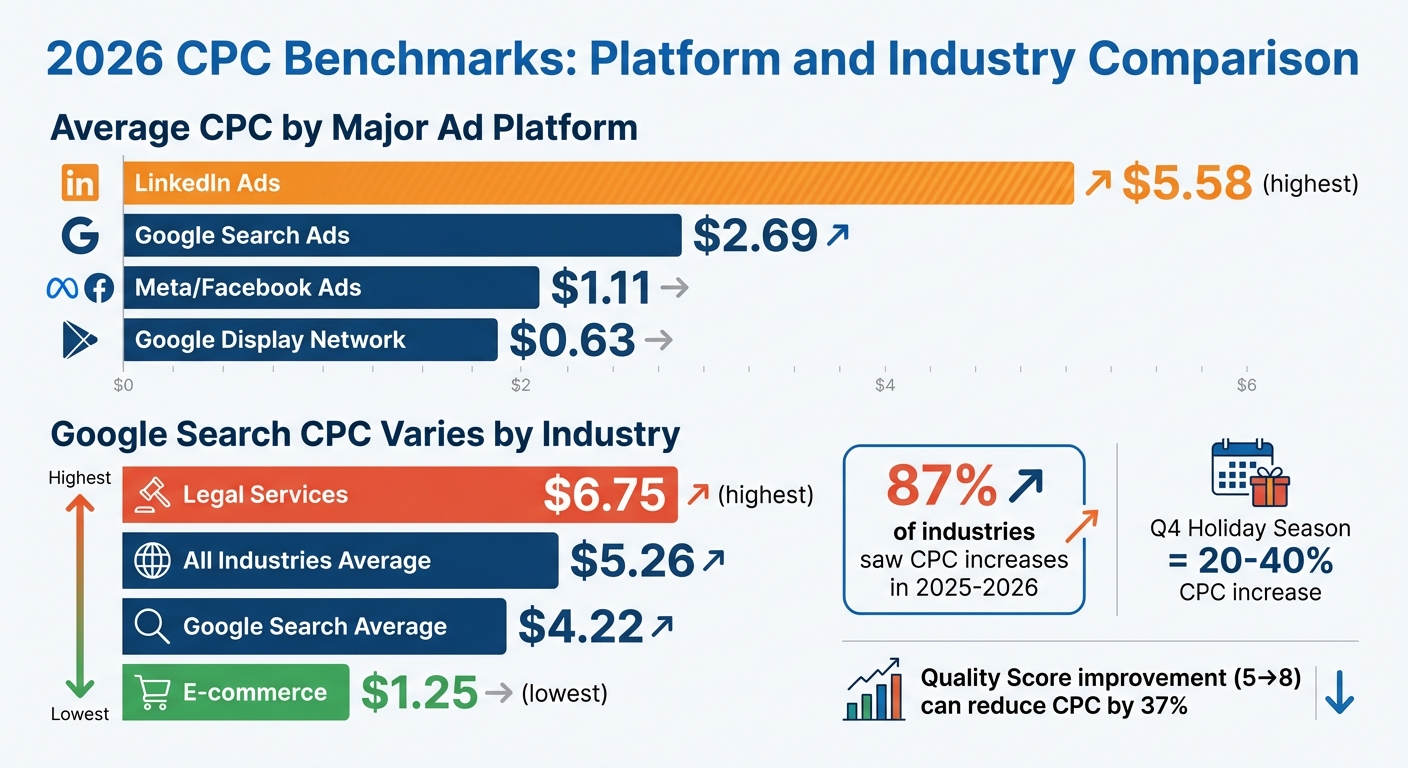
- 2026 Industry Benchmarks:
- Google Search Ads: $2.69 (average)
- LinkedIn Ads: $5.58 (highest average CPC among platforms)
- Search CPCs by industry vary widely (e.g., Legal: $6.75; E-commerce: $1.25).
- Factors Affecting CPC: Auction competition, Quality Score, platform, ad format, device type, and location all play a role.
- How to Analyze: Compare your CPC to industry benchmarks and your own profit margins. If your CPC is higher than expected, check for issues like poor targeting or low ad quality.
- Optimization Tips: Improve your Quality Score, refine audience targeting, and adjust bidding strategies to lower costs.
Bottom line: Benchmarking CPC helps you understand if you’re spending wisely or need to adjust your strategy. Whether you’re running Google Ads, Meta Ads, or LinkedIn campaigns, knowing your benchmarks ensures you’re not overpaying for clicks.
2026 CPC Benchmarks by Platform and Industry
Paid advertising benchmarks and cost efficiency improvements
sbb-itb-2ec70df
What Is CPC and How to Calculate It
Cost-Per-Click (CPC) is a metric used in paid advertising to measure how much you pay each time someone clicks on your ad. It’s a common pricing model on platforms like Google Ads, Meta Ads, and LinkedIn, where advertisers are charged based on user interaction rather than mere ad impressions.
The formula to calculate CPC is straightforward:
CPC = Total Campaign Cost ÷ Total Number of Clicks
For example, if you spend $1,000 on a campaign and receive 400 clicks, your CPC would be $2.50. This number helps you understand how efficiently your budget is being used.
"Your CPC can serve as a thermometer for gauging the performance of your ads and your ad strategy."
– WebFX
Monitoring your CPC gives you real-time insights into how well your ads are performing. A high CPC might indicate issues like poor audience targeting or a low Quality Score, while a lower CPC suggests your ads are relevant and competitive. This metric is also essential for budgeting and planning future campaigns.
CPC directly affects profitability. To calculate your Cost Per Acquisition (CPA), divide your CPC by your conversion rate. For instance, if your CPC is $3.00 and your conversion rate is 5%, your CPA would be $60.00. Comparing your CPA to industry benchmarks can help you fine-tune your campaigns. Ultimately, keeping an eye on your CPC ensures you’re acquiring customers efficiently and cost-effectively.
Why CPC Matters for Paid Media
Understanding CPC is crucial when shaping your paid media strategy. It plays a significant role in determining whether your campaigns deliver value or drain your budget. Platforms like Google Ads and Meta Ads use CPC to dictate how much traffic you can afford and which audiences you can target. For context, in 2025, the all-industry average CPC on Google Search was $5.26, reflecting a 13% increase from the previous year. Google Display Network ads averaged $0.63, while Facebook ads hovered around $1.11. LinkedIn, known for its B2B focus, had CPCs ranging from $10.48 to $15.72.
These averages highlight how CPC shapes your cost structure. For example, legal services firms often face higher CPCs, averaging $8.58 due to intense competition, while e-commerce businesses might see lower averages around $1.16. Without comparing your CPC to these benchmarks, it’s tough to determine if your costs are reasonable or if your targeting strategy needs adjustment.
CPC is also tied to your Quality Score in Google Ads. Improving your Quality Score – say, from 5 to 8 – can lower your CPC by around 30%. Enhancing ad relevance and creating a better landing page experience not only boosts performance but also reduces costs, offering a clear path to optimize your campaigns further.
What Affects Your CPC
CPC, or cost-per-click, is influenced by a mix of factors – some within your control and others that aren’t. Getting a handle on these variables can help you fine-tune your budget and optimize your campaigns. Let’s break down the key elements that shape your CPC.
Auction dynamics play a huge role. Your CPC is largely determined by your maximum bid, the competition for the same keywords or placements, and how well your ad matches the user’s intent. Ads that align closely with what users are searching for tend to cost less, while irrelevant ads face higher costs.
Quality Score is one of the most manageable factors. This score, ranging from 1 to 10, evaluates how well your keyword, ad copy, and landing page match up. A low score (1–3) can mean paying two to four times more, while a high score (8 or above) can cut costs significantly. For instance, an advertiser with a Quality Score of 8 might pay $3.00 per click, while a competitor with a score of 4 could pay $6.00 for the same position.
Platform and ad format also matter. LinkedIn tends to have higher CPCs than Meta because it targets professionals with greater buying power. Similarly, search ads generally cost more than display ads since they capture users with stronger intent to purchase. In 2026, the average CPCs for different ad types were: Search $2.10, Performance Max $1.40, Shopping $0.95, and Display $0.65.
Device type affects costs as well. Mobile CPCs are about 20% lower than desktop CPCs – $1.85 vs. $2.30 on average – but desktops often deliver a 23% higher conversion rate.
Campaign Objectives
Your campaign’s goal significantly impacts your CPC. Platforms optimize bidding based on your objectives, and actions like conversions or lead generation often come with higher costs due to their focus on user intent.
For example, on Meta, a Lead Gen campaign averages $2.10 per click, nearly double the $1.15 for a Conversions campaign and far higher than the $0.12 for Engagement campaigns. This is because lead generation focuses on collecting high-quality user data, targeting users more likely to fill out forms.
Google ads show similar trends. Search ads, which capture users at the bottom of the funnel, average $2.10 per click, while Display ads, often used for awareness, cost just $0.65 on average. YouTube ads, which are usually measured by Cost Per View (CPV), average $0.04 per view.
"Don’t choose objective based on CPC alone. Lead Gen has higher CPC but generates qualified leads. Conversions cost more but optimize for actual purchases." – Ad Performance Benchmarks Guide 2026
LinkedIn, known for its focus on B2B lead generation, has the highest average CPC among major platforms at $5.58. This premium is often justified for businesses selling complex, high-ticket products or services.
Target Audience and Location
Your target audience and location also play a big role in determining CPC. Broad keywords and audiences usually attract more competition and higher costs. On the other hand, long-tail keywords and narrowly defined audience segments often result in lower CPCs and better relevance. Segmenting your audience by demographics, interests, or behaviors can boost your Quality Score and lower your costs.
Geography matters too. Advertisers in major metropolitan areas typically pay 30% to 60% more per click than those in smaller markets. Internationally, costs vary even more. For instance, the average Search CPC in the UAE is $4.87, 8% above the US baseline of $4.51. Meanwhile, Canada averages $3.20 (29% lower), and India averages $1.04 (77% lower). In regions where local search engines dominate – like Naver in South Korea – Google Ads CPCs can be significantly lower due to reduced competition.
Device targeting also impacts CPC. Mobile devices often offer higher click-through rates and lower costs, but desktops deliver a 23% higher conversion rate for complex purchases requiring detailed forms.
Seasonality and Market Trends
CPC levels are also shaped by market dynamics and seasonal patterns. Seasonal demand can lead to predictable cost spikes. For example, CPCs typically rise by 20% to 40% during the fourth quarter (October through December) due to heightened competition during the holiday shopping season. Retailers and e-commerce brands often bid more aggressively during this period, driving up costs.
Year-over-year inflation contributes to rising CPCs as well. Between 2025 and 2026, 87% of industries saw CPC increases, fueled by more businesses shifting their ad spend to digital platforms. Increased competition and fewer organic results above the fold also play a role.
"Fundamentally, CPCs increase due to increased competition, i.e., a greater number of entrants or advertisers on a given platform." – Steven Dang, VP of Growth and Strategy, HawkSEM
Economic conditions further influence CPC. Rising prices for goods and services often lead advertisers to pay more per click, as the value of each conversion grows proportionally. High-priced or complex products, like SaaS tools or legal services, naturally command higher CPCs because their eventual conversion values are so much greater.
How to Benchmark Your CPC
Benchmarking your CPC involves more than just looking at a single number. It helps you understand the factors driving your costs and whether you’re spending efficiently. By taking a structured approach, you can identify inefficiencies, validate your strategy, and make smarter budget decisions.
Collect Your Data
Start by gathering CPC data from your ad platforms. Make sure to segment this data by channel (Search vs. Display), geography, device type, and campaign objective. This ensures you’re comparing similar data points. For example, mixing brand and non-brand keywords can distort your averages – brand keywords usually have lower CPCs and higher click-through rates, which could mask issues in your non-brand campaigns.
Use a 28–30 day baseline to smooth out short-term fluctuations. If your business experiences seasonal trends, compare year-over-year data for the same periods rather than month-over-month. For instance, comparing December 2025 to January 2026 won’t account for the typical 30–50% CPC surge during the Q4 holiday season.
It’s also important to note the difference between bidding strategies. Smart Bidding (like Target CPA or ROAS) calculates CPC algorithmically, while manual bidding gives you direct control. Use tools like Auction Insights and Keyword Planner to understand competitive pressures and set realistic CPC targets for your niche and location.
Compare Against Industry Standards
Once you’ve collected your data, compare it to industry benchmarks to see where you stand. In 2026, the average CPC across industries was $5.26, with Google Search averaging $4.22. However, these broad averages can be misleading – your industry and campaign type play a much bigger role.
For example, Legal services average $6.75 per click, while E-commerce averages just $1.25. If you’re running a law firm’s Search campaign and paying $7.50 per click, you’re slightly above average but not necessarily overpaying. On the other hand, if you’re in E-commerce and paying $3.00 per click, which is more than double the benchmark, it likely points to issues with targeting or Quality Score.
"The best competitive CPC benchmarking is really a combination of three lenses: market price signals, auction competitiveness signals, and efficiency signals." – Blobr
Don’t just focus on the average – look at the range. For instance, Legal CPCs can vary from $2.50 at the 10th percentile (low-competition, long-tail keywords) to $15.00 at the 90th percentile (highly competitive terms like "personal injury lawyer"). Knowing where you fall in this range can help you evaluate whether your targeting strategy is effective.
Analyze Your Results
With segmented data and industry benchmarks in hand, it’s time to assess what this means for your campaigns. Go beyond the raw CPC numbers to understand the bigger picture. If your CPC is within 10% of the benchmark, you’re in line with the market. If it’s 10–50% higher, consider testing new ad copy or landing pages. If it’s more than 50% above, you should review your campaign setup or audit your Google Ads immediately.
Quality Score has a huge impact on CPC. For example, a score of 8 might result in a CPC of around $3.00, while a score of 4 could push that to $6.00. Improving your Quality Score from 5 to 8 can lower your CPC by as much as 37%.
Use Impression Share diagnostics to pinpoint what’s driving your costs. If your CPC is climbing while "Lost Impression Share (Rank)" is also increasing, it means you’re losing out on Ad Rank – likely due to low Quality Scores or uncompetitive bids. Conversely, if "Lost IS (Rank)" is dropping while CPC rises, it suggests you’re spending more to gain ground in the auction.
"A profitable campaign with below-benchmark CTR beats an unprofitable one that exceeds all benchmarks." – AdBid
Finally, always consider the context. A $10.00 CPC might seem high, but if you’re selling enterprise software with an average contract value of $50,000, it’s a worthwhile expense. On the flip side, a $0.50 CPC is costly if you’re selling $5.00 impulse-buy products with a 2% conversion rate. The goal of benchmarking is to guide you toward cost-efficient customer acquisition that aligns with your business objectives.
How to Lower Your CPC
Once you’ve benchmarked your costs, the next step is optimization. Reducing your cost-per-click (CPC) isn’t about simply cutting bids – it’s about refining your ads, targeting, and bidding strategies to get more value for less money. The focus should be on improving efficiency, so you achieve the same or even better results at a lower cost.
Improve Your Ads and Formats
Boosting your Quality Score is a surefire way to lower CPC. Start by grouping your keywords into smaller, focused clusters that align closely with search intent. For instance, if someone searches for "personal injury lawyer Chicago", your ad headline should mirror those exact terms. A generic phrase like "legal services" won’t cut it. This kind of precision improves ad relevance and click-through rates, both of which enhance your Quality Score.
Your landing pages also play a big role. Make sure they deliver on the promises made in your ads. Pages should load quickly (under 3 seconds), be mobile-friendly, and align clearly with the ad’s message. These factors signal quality to algorithms and help keep CPC down.
Adding ad extensions – like sitelinks, callouts, and structured snippets – can increase your ad’s visibility and click-through rates without requiring higher bids. Regularly A/B test your ad headlines, descriptions, and visuals. High engagement can earn better placements at lower costs. On platforms like TikTok and Instagram, short-form videos (9–15 seconds) with key messages upfront are outperforming static ads in both engagement and cost efficiency.
Here’s an example: Joe Karasin managed to cut CPC from $0.79 to $0.34 by creating a strong negative keyword list. Optimized ads are the foundation for better targeting and lower costs.
Refine Your Targeting
Refining your targeting ensures you’re not wasting money on irrelevant clicks. One way to do this is by using negative keywords. Regularly review search term reports and block queries that trigger your ads but don’t lead to conversions. Additionally, opt for phrase or exact match keywords to ensure your ads show up only for highly relevant searches.
Geo-targeting can also make a big difference. Instead of targeting broad areas like entire states or countries, focus on specific cities or ZIP codes where your audience is located. If you run a local service business, there’s no point in paying for clicks from people hundreds of miles away.
Another effective tactic is using remarketing and lookalike audiences. These strategies target users who have already interacted with your brand, which often results in lower CPCs and higher conversion rates compared to targeting cold audiences. On Meta platforms, the Audience Overlap tool can help you avoid internal competition. If overlap exceeds 20%, combine those audiences to reduce costs.
Segmenting your campaigns by intent is another smart move. For example, create separate campaigns for luxury shoppers versus budget-conscious buyers, or for informational versus transactional searches. This allows you to tailor bids and strategies for each audience type.
"The more tailored your ads can be for the audience most likely to convert, the better." – Stephanie Scanlan, Vice President of Client Success, LocaliQ
Adjust Your Bidding Strategy
Aligning your bidding strategy with your goals and data insights can naturally bring down costs. For new campaigns or those with tight budgets, start with manual CPC. This gives you full control over bids and helps you establish a performance baseline without overspending.
Once you’ve gathered enough data, consider transitioning to Smart Bidding strategies like Target CPA or ROAS. Start with "Maximize Clicks" to build volume, then move to "Maximize Conversions", and finally apply Target CPA or ROAS once the algorithm has enough history to work effectively.
If you prefer to maintain control, set manual bid limits. For example, set your bids at 50–70% of your maximum profitable CPC. This approach can reduce costs by 20–40% without significantly impacting conversions. To calculate your max CPC, multiply your Customer Lifetime Value (CLV) by your conversion rate. For instance, if your CLV is $500 and your conversion rate is 5%, your max CPC would be $25.
Bid modifiers are another powerful tool. Adjust bids based on factors like device, location, and time of day. For example, if mobile conversions are 50% lower than desktop, reduce mobile bids accordingly. Similarly, use "Hour-of-Day" reports to identify peak performance times and increase bids during high-value hours while lowering them during low-performing periods.
On Meta platforms, tools like "Cost Caps" can help you keep your average CPA below a set target, while "Bid Caps" allow for strict control over maximum auction bids. For Amazon, "Dynamic Bidding – Up and Down" adjusts bids based on traffic intent, raising them for high-conversion opportunities and lowering them for less promising clicks.
"While it might be tempting to lower bids across the board to reduce cost per click, this isn’t always the right strategy… You may have a higher return on ad spend (ROAS) at a relatively higher CPC." – Sam Yadegar, Co-founder and CEO, HawkSEM
Conclusion
Understanding your CPC isn’t just about knowing the numbers – it’s about identifying whether you’re overpaying and pinpointing the factors behind those costs. This process helps you separate internal inefficiencies from external market dynamics, giving you the clarity needed to set realistic budgets, forecast effectively, and make smarter decisions.
Recent data reveals that while 87% of industries experienced a 10% rise in CPC in 2025, 65% also reported better conversion rates. The takeaway? Focus on unit economics to ensure your CPC aligns with overall profitability.
"The healthiest way to benchmark CPC is to treat it as a component of unit economics. If your conversion rate and conversion value support the CPC, you can win aggressively without regret." – Alexandre Airvault, Blobr
To make the most of these insights, start by organizing and segmenting your data. Separate brand traffic from non-brand traffic, then compare your performance to both industry benchmarks and your historical data. From there, take action: improve your Quality Score (potentially lowering CPC by 37%), and use negative keywords to eliminate wasted clicks.
Finally, refine your bidding strategy to align with your goals. Whether you’re using manual bidding or Smart Bidding, tools like Auction Insights can provide valuable guidance. Adjust bid modifiers based on device and timing, and consistently test your creatives to improve performance. By continuously benchmarking and optimizing, you’ll set the foundation for paid media campaigns that are both efficient and profitable.
FAQs
What’s a “good” CPC for my business?
A "good" Cost-Per-Click (CPC) isn’t a one-size-fits-all number – it varies depending on your industry, conversion rates, and the lifetime value of your customers. While the average CPC across industries hovers around $4.22, what truly matters is whether your CPC drives more revenue than it costs to acquire a customer.
To figure this out, calculate your maximum profitable CPC. This involves factoring in your customer lifetime value, conversion rate, and profit margins. By focusing on these metrics instead of relying solely on industry averages, you can determine what works best for your business.
How do I find my maximum profitable CPC?
To figure out your maximum profitable CPC, apply this formula: (Customer Value × Conversion Rate) × (1 – Target Profit Margin).
Here’s an example to make it clear: Let’s say your customer value is $300, your conversion rate is 8%, and your target profit margin is 40%. The calculation would look like this:
($300 × 0.08) × (1 – 0.40) = $14.40
This means your CPC should not exceed $14.40 to ensure profitability, considering your specific business metrics.
How often should I benchmark CPC?
The frequency of reviewing your CPC largely depends on your campaign’s goals and how quickly the market changes. For most campaigns, a monthly review works well. However, if you’re running campaigns in highly competitive or fast-changing industries, weekly checks might be more effective. Keeping an eye on CPC regularly helps you adjust to market shifts and make the most of your ad budget. Additionally, staying aligned with updated industry benchmarks – typically published quarterly or annually – can help ensure your CPC remains competitive and supports your overall performance targets.