

Tracking ROI across multiple marketing channels is no longer optional. With customers interacting through various touchpoints – social media, email, search engines, and more – businesses need tools that consolidate data, provide accurate attribution, and deliver actionable insights. This article highlights eight tools designed to simplify multi-channel ROI measurement, helping businesses make smarter marketing decisions.
Key Features to Look For:
- Integration: Tools should connect all marketing platforms (social, CRM, email, etc.).
- Attribution Models: First-touch, last-touch, time-decay, and more for precise ROI analysis.
- Real-Time Analytics: Monitor campaign performance and adjust strategies instantly.
- Scalability: Handle growing data and campaign complexity.
- Privacy Compliance: Adhere to U.S. regulations like GDPR and CCPA.
- User-Friendly Dashboards: Clear, customizable interfaces for quick insights.
Tools Covered:
- Google Analytics 4: Free, event-based tracking with multiple attribution models.
- Adobe Analytics: Advanced segmentation and real-time insights for enterprises.
- HubSpot Marketing Hub: Centralized data and flexible attribution for lead-focused businesses.
- Segment: Unified customer data for accurate multi-touch attribution.
- Rockerbox: Multi-touch attribution and offline channel tracking.
- Mixpanel: User behavior analysis and real-time reporting for startups.
- Tableau: Data visualization for analyzing complex ROI metrics.
- Growth-onomics: A data-driven agency offering machine learning-powered attribution.
Quick Comparison
| Tool | Best For | Key Features | Starting Price |
|---|---|---|---|
| Google Analytics 4 | Small businesses | Free, real-time insights, multiple models | Free |
| Adobe Analytics | Large enterprises | Advanced segmentation, real-time data | Custom pricing |
| HubSpot Marketing Hub | B2B lead generation | Attribution models, CRM integration | $800/month |
| Segment | Businesses with fragmented data | Unified customer data, real-time updates | Custom pricing |
| Rockerbox | Mid-sized companies | Offline tracking, flexible attribution | $200+/month |
| Mixpanel | Startups | User behavior tracking, instant reporting | Free/$25+/month |
| Tableau | Data-driven organizations | Advanced dashboards, predictive analytics | $70/user/month |
| Growth-onomics | Growth-focused businesses | Machine learning, real-time insights | Custom pricing |
These tools cater to various business needs, from startups to enterprises, ensuring clear ROI measurement across channels. Choose the one that aligns with your goals and scale.
Mastering Multi-Channel Attribution: Top 5 Tools
What to Look for in Multi-Channel ROI Measurement Tools
Picking the right multi-channel ROI measurement tool isn’t just a technical decision – it’s a strategic one. With 73% of consumers engaging with multiple channels during their shopping journey, your tool needs to handle this complexity seamlessly. Here’s what to consider when making your choice.
Integration Capabilities
Your measurement tool must connect all your marketing channels, from social media and email platforms to offline stores and third-party marketplaces. It should integrate with systems like your CRM, e-commerce platform, marketing automation tools, customer service software, and analytics programs. This creates a single customer view, which simplifies attribution and enables personalized experiences across every touchpoint.
Data Accuracy and Real-Time Analytics
Accurate data and real-time insights are game-changers. Companies that leverage data analytics are 2.2x more likely to lead the market. Your tool should provide unified marketing measurement (UMM), combining data from all channels into a single, cohesive view.
Real-time analytics allow you to monitor performance continuously and make adjustments when campaigns underperform or customer behavior shifts. This adaptability pays off – marketers using UMM often see an average 9.5% increase in annual revenue.
Flexible Attribution Models
Attribution is critical for understanding which channels drive results. Look for tools offering multiple models, such as first-touch, last-touch, linear, time-decay, and data-driven approaches. Different journeys require different attribution methods, so having flexibility ensures more accurate ROI calculations.
Scalability for Growth
Your tool should grow with your business. As you expand into new channels or increase campaign volume, it must handle larger data loads without losing accuracy or performance. Evaluate its capacity not just for today but for your future growth plans.
Compliance with U.S. Data Privacy Laws
Data privacy isn’t optional. With the average cost of data breaches hitting $4.45 million in 2023, compliance with laws like CCPA, COPPA, and state-specific regulations is non-negotiable. Non-compliance can add nearly $220,000 to breach costs.
"When customers feel confident that their data is secure with you, they’re more likely to trust your ability to provide high-quality products and services." – Salesforce
Your tool should include features like consent management, data encryption, and secure storage. It should also support privacy-by-design principles and provide audit trails for compliance reporting.
Unified Dashboards for Decision-Making
A user-friendly interface can make or break your measurement strategy. With 71% of marketers enjoying using marketing dashboards, your tool should present multi-channel data in intuitive, customizable dashboards. These dashboards should let you compare performance across channels, identify trends, and drill into specific campaigns or customer segments. Visual tools like charts, graphs, and heat maps make it easier to pinpoint opportunities and issues.
A great example of this in action is PUMA. By unifying customer data and delivering personalized messaging, the brand saw a boost in open rates, database growth, and a surge in weekly newsletter subscribers – all within six months.
These features are essential for choosing a multi-channel ROI measurement tool that meets your needs today and adapts as your business evolves.
1. Google Analytics 4
Google Analytics 4 (GA4) is a free tool designed to help businesses track and analyze customer interactions across multiple channels. By using an event-based data model instead of the traditional session-based approach, GA4 provides a clearer picture of the entire customer journey, making it an essential resource for businesses aiming to optimize their marketing efforts.
Integration Capabilities
One of GA4’s standout features is how well it integrates with other tools in Google’s marketing ecosystem and beyond. It connects seamlessly with platforms like Google Ads, Search Ads 360, Display & Video 360, Google Cloud, and Google Search Console. By linking GA4 with tools such as BigQuery, Google Optimize, and Google Ads Manager, businesses can enhance their data for advanced analysis and automated campaign improvements.
The results speak for themselves. In 2022, McDonald’s Hong Kong leveraged GA4’s integrations to boost in-app orders by an impressive 550%. Similarly, Lider experienced an 18× increase in conversion rates while reducing its cost per acquisition by 85%.
"Google Analytics allows us to look at our data across platforms – web and app – to understand the full journey of our users. We’ve been able to cut our reporting time by 50%."
– Sara Swaney, Director of Advancement, 412 Food Rescue
These integrations make it easier to achieve precise attribution and access real-time analytics, which are critical for informed decision-making.
Data Accuracy and Attribution Models
GA4 takes attribution to a new level by offering multiple models to better understand how different marketing efforts contribute to conversions. Options include first-touch, last-touch, linear, time-decay, and data-driven models. Combined with its three attribution scopes – user, session, and event – GA4 allows businesses to customize insights to match their goals .
"GA4 attribution isn’t just a settings tweak – it’s a strategic lever that can shape how your entire marketing funnel is valued."
– Dan Taylor, Head of Technical SEO, SALT.agency
The Model Comparison Tool is another game-changer, letting you compare different attribution models side-by-side to see how they impact your marketing performance. Plus, GA4 applies changes retroactively, ensuring consistent historical data while allowing you to refine your approach .
Real-Time Analytics and Reporting
GA4 doesn’t just stop at accurate attribution – it also delivers real-time insights that help businesses stay agile. By monitoring events across websites and apps simultaneously, GA4 provides a unified view of user behavior. This means you can track live conversion data, audience activity, and channel performance all in one place.
On top of that, GA4 uses machine learning to predict customer behavior, helping you identify high-value prospects before they make a purchase. This predictive capability is a powerful tool for businesses looking to maximize their marketing ROI.
Scalability for U.S.-Based Businesses
For businesses in the U.S., GA4 offers the flexibility to grow alongside their marketing efforts. Its infrastructure is built to handle increased campaign volume and new channels while maintaining compliance with evolving privacy regulations, including cookieless tracking.
GA4 supports up to 100 audiences per property, 50 custom dimensions, and a data retention period of up to 14 months for standard accounts. Additionally, users can create up to 200 explorations and share 500 across their team, making it easier to dive into detailed analyses.
Its unified data framework ensures consistent audience segmentation and cross-channel attribution, making it a reliable tool for scaling campaigns while maintaining accuracy.
"GA4 Attribution goes beyond traditional tracking by offering a nuanced view of how each marketing channel contributes to the customer journey."
– Trackingplan
2. Adobe Analytics
Adobe Analytics provides powerful tools for tracking and analyzing multi-channel ROI, offering advanced attribution models and seamless integrations across various platforms. It helps businesses make smarter decisions about their marketing spend by delivering precise, real-time insights.
Integration Capabilities
Adobe Analytics connects effortlessly with platforms like Adobe Advertising Cloud, Marketo Engage, Google Ads, and Facebook Ads, making it easier to analyze campaigns and nurture leads effectively.
Companies using the Adobe Experience Cloud, which includes Adobe Analytics, have reported an ROI exceeding 330%. This impressive figure highlights the benefits of using integrated marketing tools that work together, rather than functioning in isolation. To maximize these integrations, Adobe recommends using Adobe Launch (now called Tags) for streamlined connectivity with other Experience Cloud solutions. Additionally, implementing an Event-Driven Data Layer (EDDL) strategy can help optimize tracking and ensure smooth integration with Adobe Launch. These features enhance data accuracy and support flexible attribution models, setting Adobe Analytics apart.
Data Accuracy and Attribution Models
With Attribution IQ, Adobe Analytics provides multiple attribution models, enabling businesses to gain deeper insights into conversions. This tool goes beyond just analyzing paid media, allowing companies to compare unlimited attribution models without additional setup and to study customer journeys across different audience segments. Given that enterprise customers typically interact with 7–10 meaningful touchpoints before converting, having accurate attribution is crucial for understanding the true impact of marketing efforts.
For example, a global retailer used Adobe’s Cross-Device Analytics to track customers transitioning from mobile to desktop. By reallocating ad spend to align with peak mobile usage, they achieved a 23% increase in conversions and reduced acquisition costs by 15%.
Adobe Analytics also supports various attribution approaches, such as First Touch and Last Touch models, which are particularly effective for acquisition analysis. Custom eVars and tailored attribution models add further flexibility, catering to diverse business needs. Beyond attribution, the platform excels in delivering actionable, real-time reporting.
Real-Time Analytics and Reporting
Adobe Analytics provides real-time insights, with web traffic and page rank data updated in under two minutes.
"Real-time reporting displays web page traffic and ranks page views in real time. Provides actionable data to base your business decisions on."
- Adobe Analytics
Users can create up to three real-time reports per report suite and access up to two hours of historical data with intervals as short as one minute. Starting in March 2025, Adobe announced that key metrics will be available in real time, with a latency of less than five minutes from data ingestion to reporting in Customer Journey Analytics. This is particularly beneficial for streaming media businesses, allowing them to monitor live events and major content releases as they happen.
Scalability for U.S.-Based Businesses
Adobe Analytics is designed to scale alongside growing marketing efforts, maintaining data accuracy and delivering consistent insights across all channels. Its robust infrastructure supports businesses as they expand, ensuring reliable performance even with increased campaign volumes.
For U.S.-based companies, Adobe Analytics offers the reliability and compliance features necessary for operating at scale. Its ability to handle complex attribution scenarios and provide real-time insights makes it an essential tool for managing large-scale, multi-channel marketing operations efficiently.
3. HubSpot Marketing Hub
HubSpot Marketing Hub simplifies multi-channel marketing by centralizing data and connecting with essential platforms. By consolidating information from various touchpoints, it helps marketers track campaign performance and refine their strategies across different channels.
Integration Capabilities
HubSpot offers a wide range of integrations through its app marketplace and custom APIs. It connects seamlessly with major advertising platforms like Facebook, LinkedIn, Twitter, Instagram, and Google Ads. Additionally, analytics tools such as Google Analytics link customer activity with web performance data, providing deeper insights into marketing and sales leads.
The benefits of these integrations are impressive. Studies reveal that integrated CRM systems save teams four hours per week, improve retention rates by 36%, enhance forecast accuracy by 38%, and deliver an ROI of 871%.
Tools like Cometly further enhance HubSpot’s functionality by syncing ad platforms, forms, revenue, and CRM data. This allows for real-time, accurate attribution, showing which ads and campaigns are driving leads, deals, and revenue. Another option, ChannelMix, aggregates and models data from across the marketing ecosystem, creating a unified view of performance metrics. These integrations enable precise data tracking and attribution.
Data Accuracy and Attribution Models
HubSpot offers a variety of attribution models to analyze customer interactions. These include Linear, First interaction, Last interaction, U-shaped, W-shaped, Time decay, Full path, J-shaped, and Inverse J-shaped models, each suited to different business objectives.
For example, the U-shaped model assigns 40% of the credit to both the first interaction and lead conversion, with the remaining 20% spread across other touchpoints. The W-shaped model allocates 30% each to the first interaction, lead creation, and deal creation, with 10% distributed among other interactions. Businesses with longer sales cycles might prefer the Time decay model, which gives more weight to interactions closer to the conversion point.
These models help businesses understand the true ROI of their marketing efforts.
| Attribution Model | Credit Distribution | Ideal For |
|---|---|---|
| Linear | Equal credit to all interactions | Gaining a complete view of all marketing channels |
| U-Shaped | 40% to first interaction, 40% to lead conversion, 20% to others | Identifying qualified leads |
| W-Shaped | 30% to first interaction, 30% to lead creation, 30% to deal creation, 10% to others | Fast-moving sales cycles |
| Full Path | 22.5% each to first interaction, lead creation, deal creation, and last interaction, 10% to others | Balancing focus across the entire funnel |
Advanced attribution reporting and custom model creation are available in the Professional and Enterprise tiers of the platform.
Real-Time Analytics and Reporting
HubSpot Marketing Hub provides real-time analytics through customizable dashboards and reports, presenting data in a clear and actionable format. The platform tracks key metrics like website performance, traffic trends, and conversion rates, offering instant insights into campaign success. This real-time visibility complements its integration and attribution features, enabling consistent measurement across all channels.
These analytics are critical, as 73% of top-performing sales teams rely on data-driven decision-making. Moreover, conversion rates are a top priority for over one-third of marketing leaders, making HubSpot’s reporting tools invaluable.
Scalability for U.S.-Based Businesses
HubSpot is designed to grow alongside your business. With four pricing tiers ranging from Free to Enterprise, it offers flexibility for companies of all sizes. The Professional tier starts at $800 per month (annual commitment required), while the Enterprise tier begins at $3,600 per month. This tiered approach allows businesses to start with essential features and expand as their marketing needs evolve. The platform’s capabilities ensure smooth scaling, even as campaign complexity and channel volume increase, making it an excellent choice for managing multi-channel marketing efforts effectively.
4. Segment
Segment is a data infrastructure platform designed to simplify how businesses collect, clean, and share customer data across various marketing channels. Instead of creating separate connections for every data source and destination, Segment provides a single integration point, making data distribution more efficient.
Integration Capabilities
Segment shines in its ability to bring together data from multiple channels. Handling a staggering 12.1 trillion API calls annually, it’s built to manage even the largest enterprise data needs. With over 700 pre-built integrations, businesses can connect their existing tools without the hassle of custom development. Companies using Segment report reducing the time needed to onboard new data sources by an impressive 93%. This seamless data flow enables accurate attribution across every customer interaction.
"Segment allows us to compile data all in one place, forming a Golden Profile, and allows for other teams to easily utilize and activate data." – Rick Troiani, Director of Omni-Channel Engagement Architecture, Sanofi
For businesses with unique requirements, Segment also provides custom APIs to integrate proprietary data sources and destinations.
Data Accuracy and Attribution Models
In a world where 75% of marketers rely on multi-channel strategies and B2B customers navigate an average of 36 touchpoints before converting, understanding the impact of each channel is critical. Segment simplifies this with its flexible attribution models, helping businesses measure ROI across complex customer journeys.
Here’s a breakdown of the attribution models Segment supports:
- First-touch attribution: Assigns credit to the first interaction, ideal for evaluating brand awareness campaigns.
- Last-touch attribution: Focuses on the final interaction before conversion.
- Linear multi-touch attribution: Spreads credit evenly across all touchpoints.
- Time-decay attribution: Gives more weight to interactions closer to the conversion.
- U-Shape attribution: Highlights the first and last touchpoints.
- W-Shape attribution: Allocates credit to the first, middle, and last interactions.
| Attribution Model | Credit Distribution | Best Use Case |
|---|---|---|
| First-Touch | Credits solely to first interaction | Brand awareness and top-funnel measurement |
| Last-Touch | Credits solely to final interaction | Direct response and bottom-funnel optimization |
| Linear Multi-Touch | Equal credit across all touchpoints | Comprehensive customer journey analysis |
| Time-Decay | More weight to recent interactions | Bottom-funnel focus with recency in mind |
| U-Shape | Emphasis on first and last touchpoints | Balanced top and bottom-funnel evaluation |
| W-Shape | Credit to first, middle, and last points | In-depth multi-channel campaign analysis |
These models, combined with Segment’s real-time insights, empower teams to make informed decisions and refine their strategies.
Real-Time Analytics and Reporting
Segment enables businesses to deliver real-time event data to downstream tools, allowing marketers to react swiftly to shifts in campaign performance. This capability is a game-changer, as companies using real-time data have been shown to boost efficiency by up to 30%.
With its Profile API, businesses can programmatically access user or account data, supporting in-app personalization and complex marketing initiatives. Additionally, real-time audience segmentation automatically updates user groups as they meet specific criteria. However, it’s worth noting that some destinations may update on a 2–3 hour batch cycle. This near-instantaneous data flow is especially valuable for industries like e-commerce, publishing, and event management, where timing is everything.
sbb-itb-2ec70df
5. Rockerbox
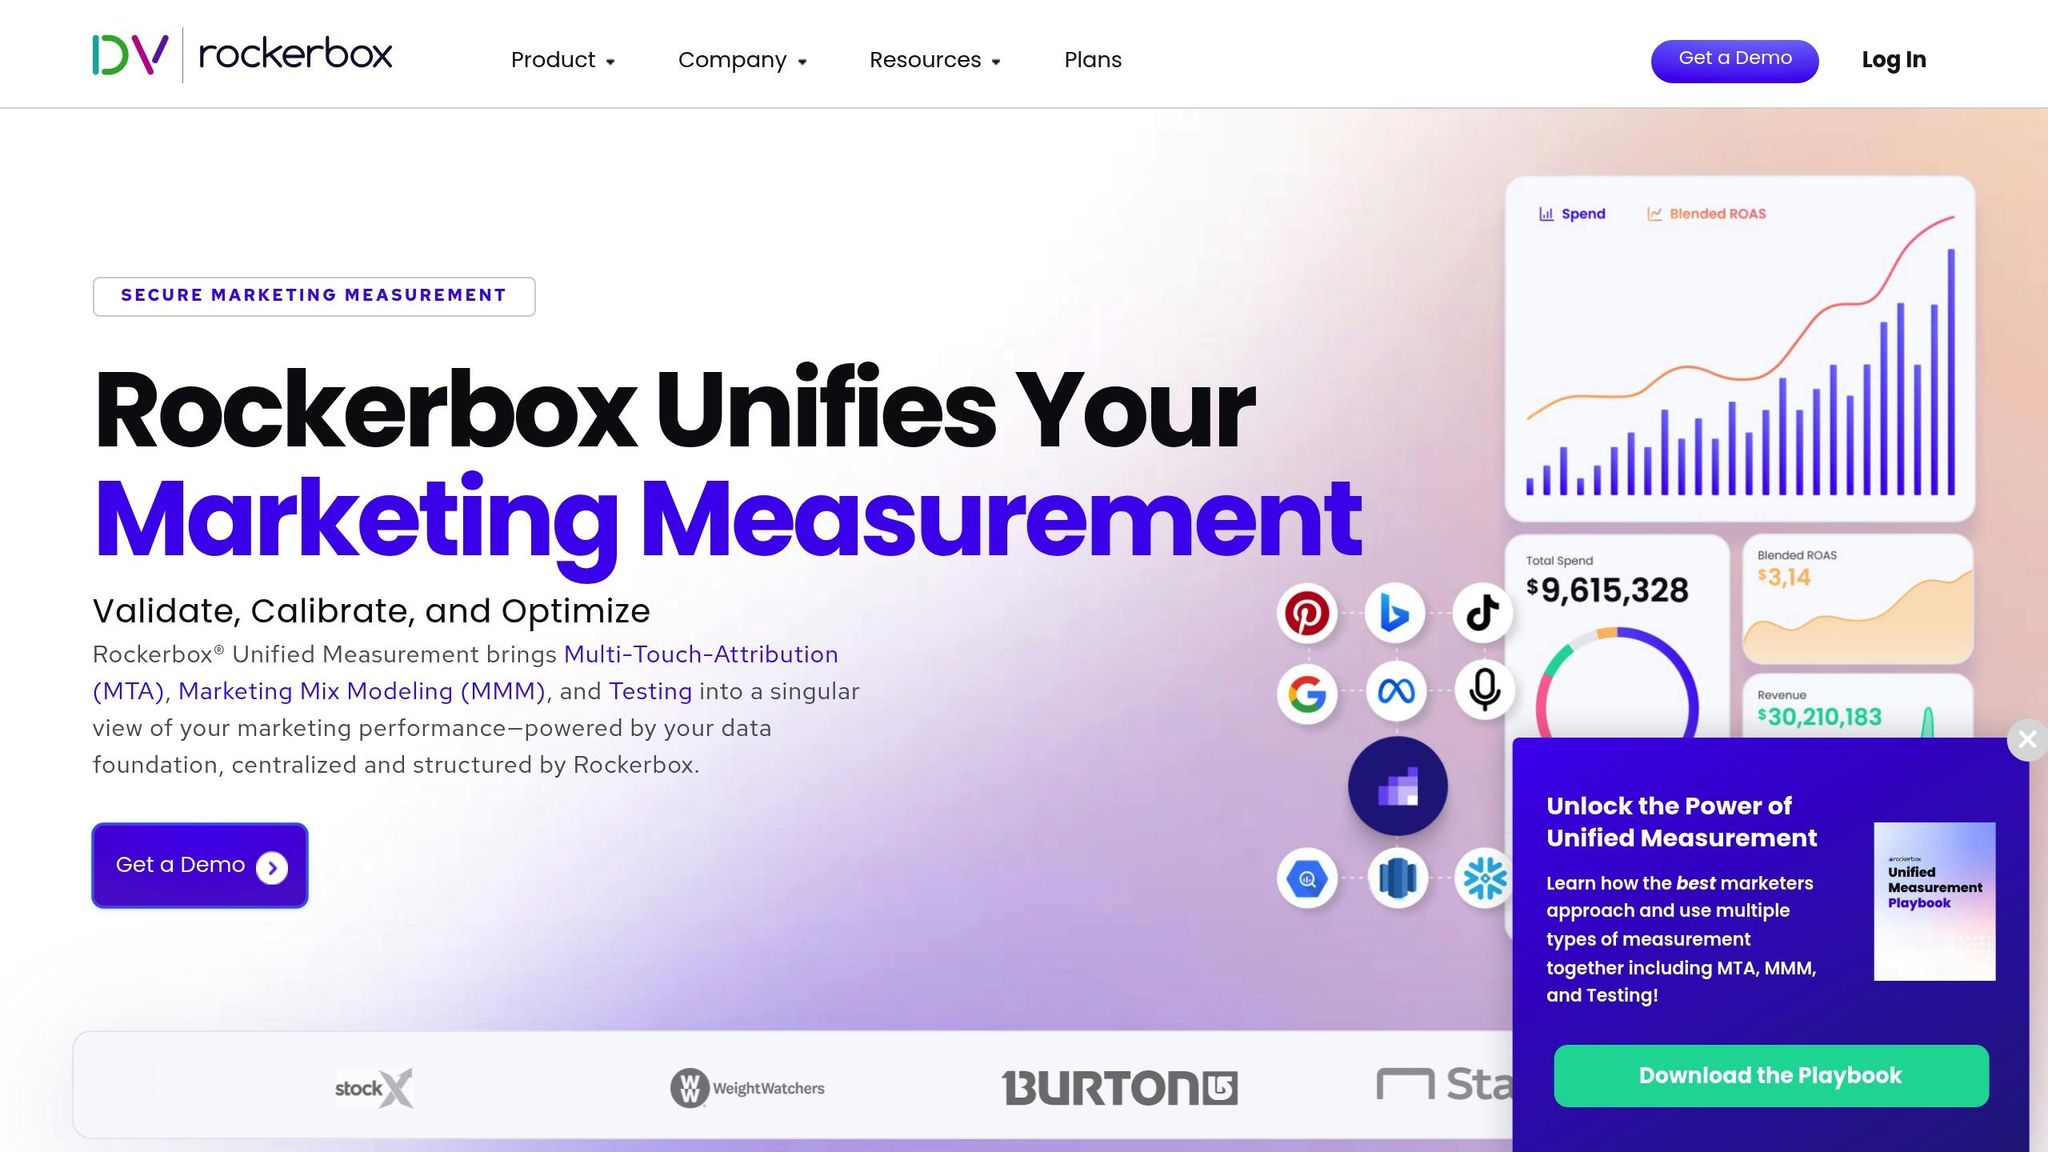
Rockerbox serves as a comprehensive measurement platform, blending advanced attribution, mix modeling, and incrementality testing. This enables businesses to move past fragmented reporting and make informed, data-driven decisions across their marketing efforts.
Integration Capabilities
Rockerbox connects seamlessly with over 100 platforms, covering major players like Facebook Ads Manager, Google Ads, TikTok, and LinkedIn. It also bridges offline channels through specialized partnerships. The platform includes pre-built integrations with direct mail providers and OTT services such as MNTN, Tinuiti, and Tatari, using tools like impression tracking pixels and log files. This setup consolidates online and offline marketing data into a single, structured dataset for better analysis and decision-making.
To date, Rockerbox has tracked $9.89 billion in marketing spend across top brands, saving its clients over $300 million in unnecessary ad expenses and 1.6 million hours in 2024 through streamlined data collection and analysis. Its extensive integration capabilities provide businesses with a more accurate and centralized measurement model.
"Rockerbox is a perfect fit for our complex marketing strategy. No other platform was able to accommodate the decentralized nature of our various markets and yet still provide us a cohesive and clear understanding of their impact at large and on a granular level. Working with Rockerbox gives us the full-stack approach to marketing measurement we need to continue to scale." – David Cohen, Chief Data Officer at Weight Watchers
Data Accuracy and Attribution Models
Rockerbox leverages its robust integrations to capture comprehensive data, enabling it to create custom attribution models through logistic regression. These models align with mix modeling and incrementality testing, accounting for hidden variables, offline influences, and channel complexities .
For instance, jewelry brand gorjana achieved a tenfold increase in marketing spend and doubled its return on ad spend (ROAS) using Rockerbox’s custom multi-touch attribution model. This provided the brand with full visibility into cross-channel performance.
"Rockerbox has allowed us to feel confident in scaling and seeing how our dollars influence the entire customer journey. We have so much more intelligence in terms of optimizing campaigns holistically and knowing where these campaigns fit within the customer journey." – gorjana Team
Scalability for U.S.-Based Businesses
Rockerbox caters to businesses of all sizes, offering flexible pricing plans. These include a free plan for small businesses and startups, a Starter plan starting at $200 per month for growing companies, and a Scale plan designed for large enterprises with more complex attribution needs. The platform is also SOC2 compliant, ensuring high standards of security and privacy, making it a trusted choice for leading brands .
In February 2025, DoubleVerify acquired Rockerbox to merge customer journey insights, advanced attribution, performance analytics, and AI-powered activation into a single platform. A test with a global weight-loss brand demonstrated the integration’s impact, achieving a 39% reduction in CPA for one campaign and 20% for another.
"By combining DV’s trusted data and Rockerbox’s outcome measurement, we’re delivering the industry’s best full-funnel measurement offering – opening up new growth opportunities for current DV customers and expanding DV’s basket of solutions to attract new ones." – Ron Jacobson, CEO of Rockerbox
With its robust features, secure compliance, and adaptable pricing, Rockerbox empowers businesses to gain unified insights into their multi-channel ROI.
6. Mixpanel
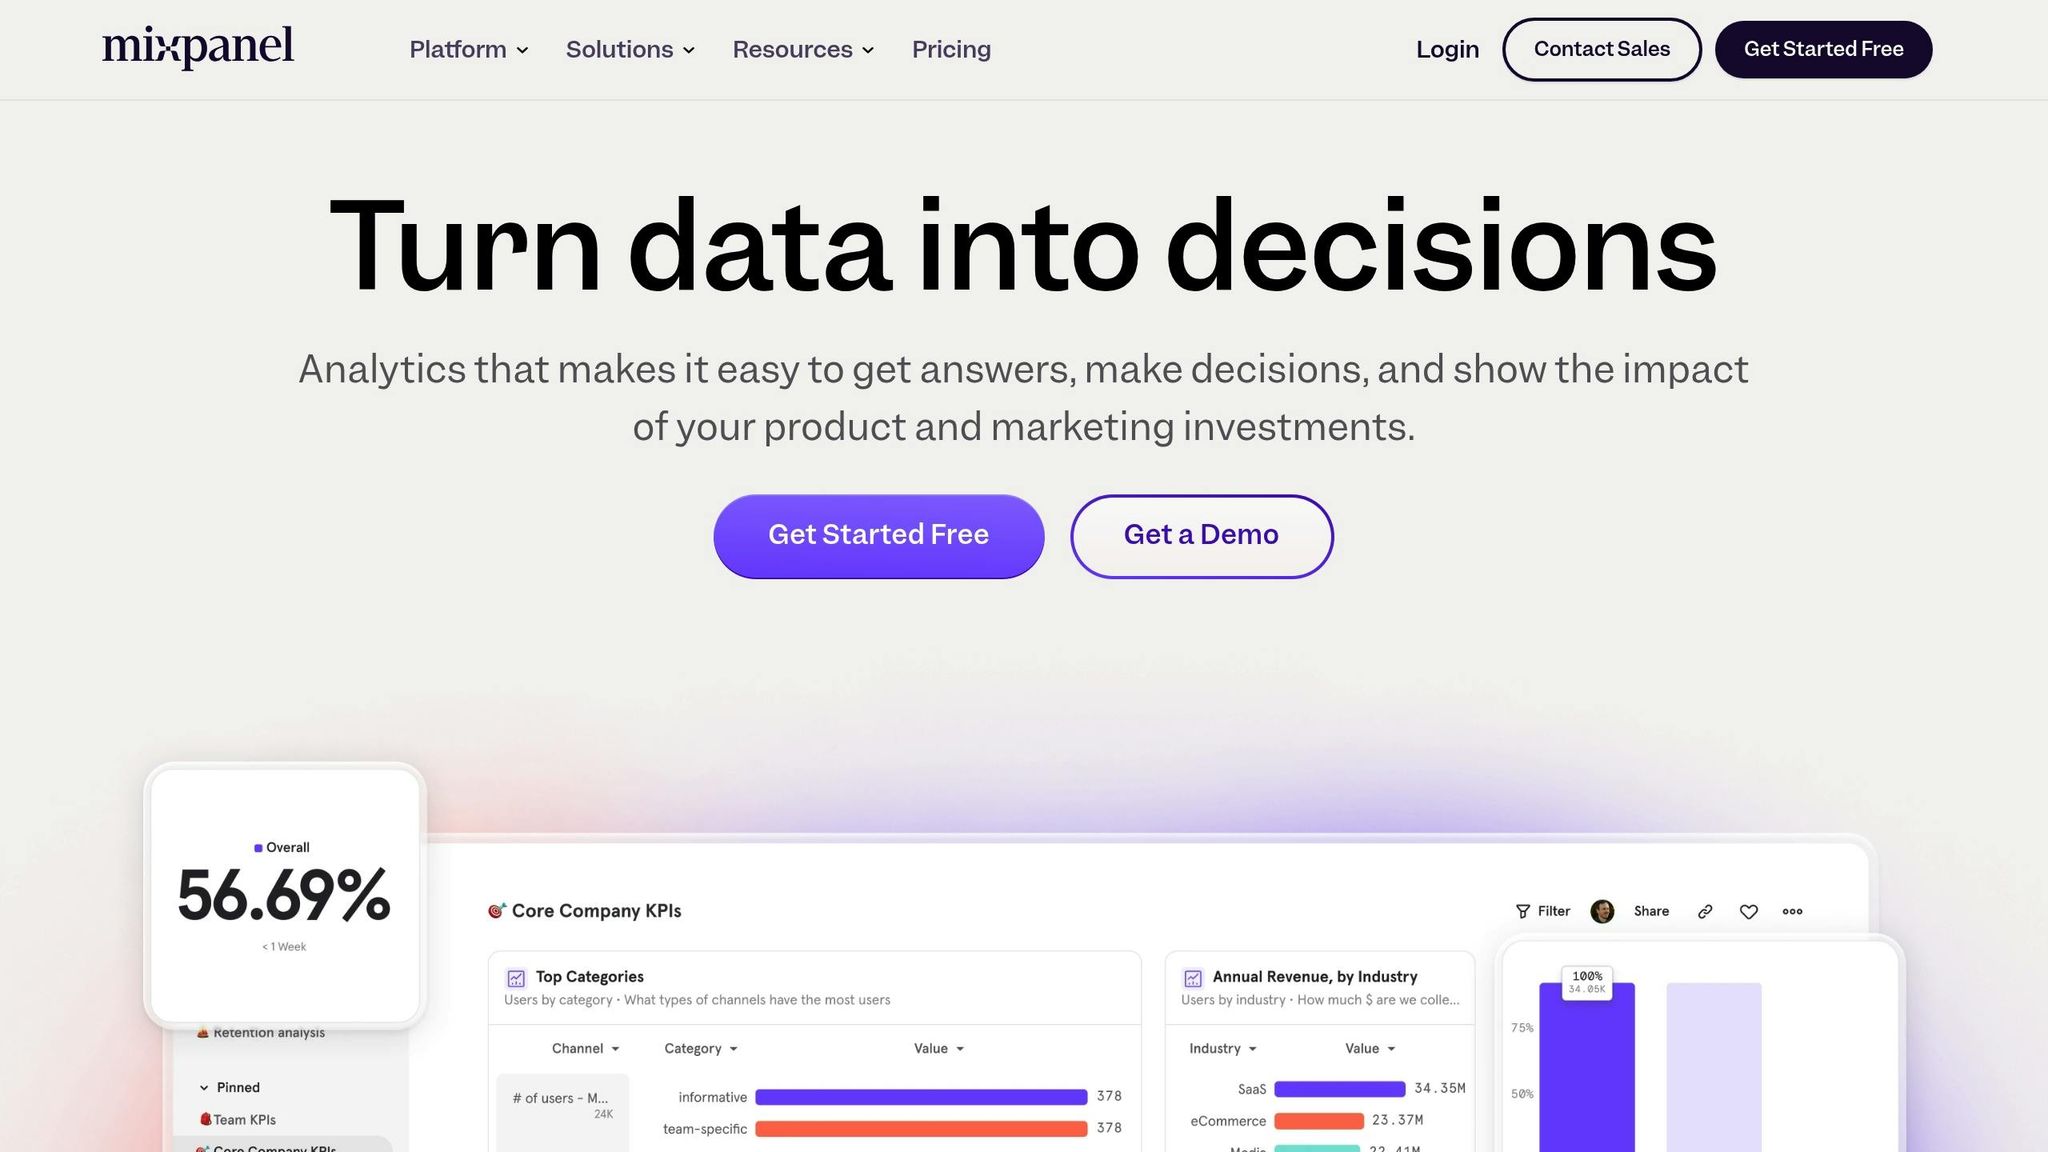
Mixpanel is an analytics platform designed to track users’ actions across various marketing touchpoints. Unlike traditional tools that focus on aggregated data, Mixpanel zeroes in on individual user actions and their journey through your marketing funnel. Businesses using Mixpanel have reported saving 35.4% of their time and making decisions 79% faster, which ultimately helps them measure ROI more effectively across channels.
Integration Capabilities
Mixpanel integrates seamlessly with a wide range of systems, thanks to its APIs, SDKs, webhooks, and third-party connectors. This flexibility ensures smooth data collection across web, mobile, server, cloud, and app environments. It also supports bi-directional syncing of user profiles between platforms. Developers can streamline their workflow by using Segment as a data hub, needing only to master core API methods like identify, track, and alias. For example, email integrations automatically send events like "Email Delivered", "Opened", and "Clicked" to Mixpanel, while live chat tools push events such as "Live Chat Started" and "Message Sent" without requiring custom tracking.
"Mixpanel’s integrations seamlessly integrate to deliver best-of-breed solutions to customers, empowered by our user insights."
For enterprise-level data management, Mixpanel connects with major data warehouses like Snowflake, BigQuery, and Redshift. This allows businesses to consolidate revenue data, customer metrics, and marketing analytics into a single source of truth. These powerful integrations enable Mixpanel to deliver real-time, actionable insights.
Real-Time Analytics and Reporting
One of Mixpanel’s standout features is its real-time reporting, which provides metrics and dimensions within seconds – avoiding the delays common with many analytics platforms. This instant access to data integrates directly with CRM tools, offering continuously updated, unsampled information. Unlike Google Analytics, which has a 30-minute real-time window, Mixpanel provides immediate dashboards that allow teams to track behavior, validate performance, and identify trends as they happen. This capability can save ad spend and improve ROI across multiple channels.
Scalability for U.S.-Based Businesses
Mixpanel is designed to grow alongside businesses, offering tools that make it easy for non-technical users to explore data and make decisions independently. This reduces bottlenecks and speeds up the decision-making process.
For instance, Quicken transitioned from Adobe Analytics to Mixpanel, gaining access to more flexible reporting and custom dashboards. This shift improved collaboration across finance, engineering, and marketing teams while breaking down data silos. Employment Hero, which serves over 300,000 businesses with 2 million active users, uses Mixpanel Session Replay to gather qualitative insights, saving over 8 hours of manual data consolidation per release. Similarly, Yelp has shortened its product analysis timelines from weeks to days. Evulpo leverages Mixpanel to monitor financial metrics, tripling the accuracy of its financial forecasts.
"With Mixpanel, we now have a reliable base that helps us better understand our runway and plan our growth. Sharing this data with our investors has built trust and contributed to successful fundraising."
– Matteo Borinelli, Head of Controlling at Evulpo
"The great value of Mixpanel is its ease of use. Even if a colleague doesn’t have strong data skills, he or she can still self-serve to answer basic questions."
– Jaryd Zinkewich, Director of Strategic Insights and Decision Support at ATB Financial
7. Tableau
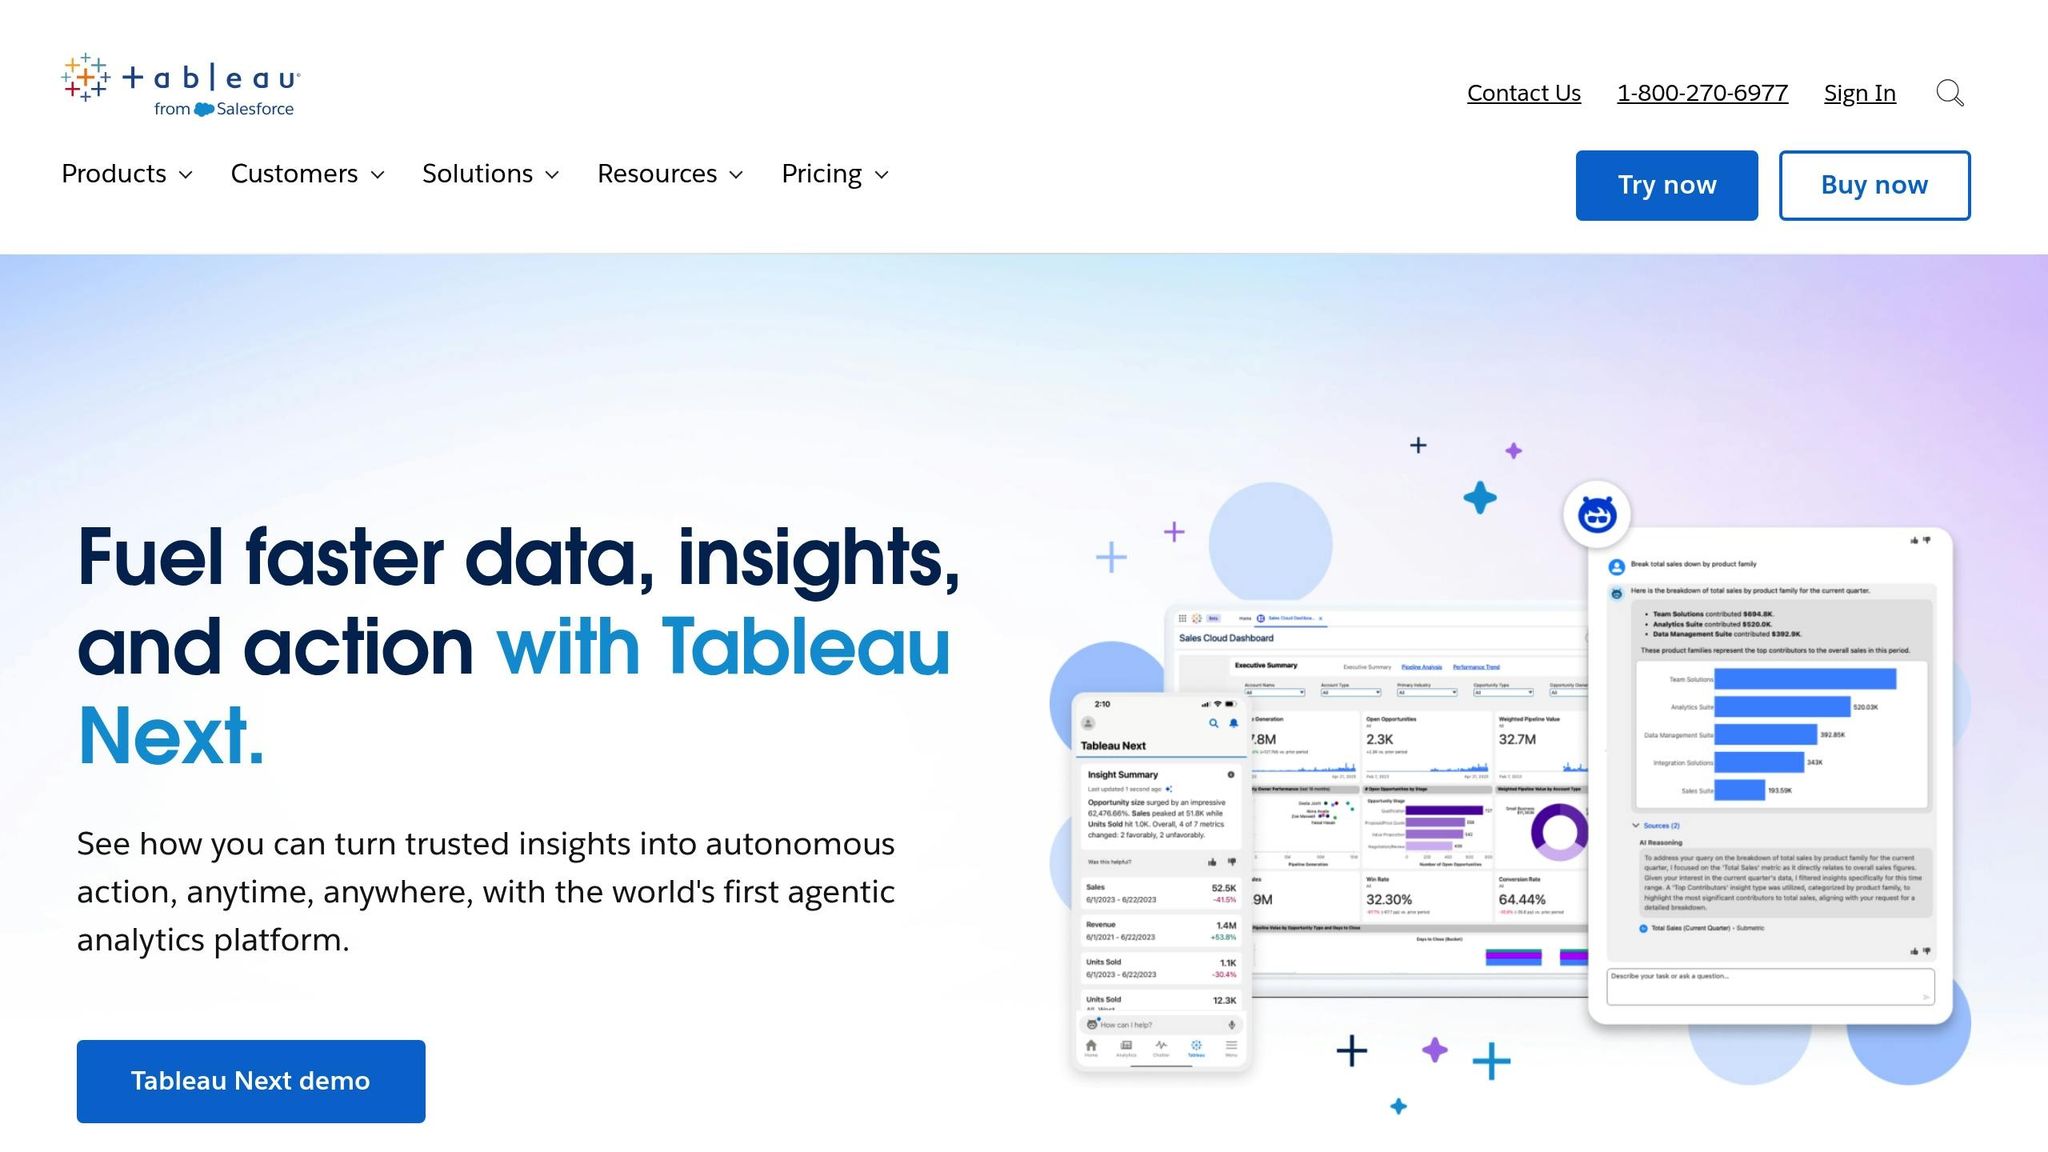
Tableau is a leading data visualization platform designed to simplify complex, multi-channel data into actionable insights. Unlike traditional analytics tools that often focus on isolated data streams, Tableau stands out by combining marketing data into a unified view. This allows businesses to analyze digital media spending, social media performance, website metrics, and even full customer journeys – all in one place.
Integration Capabilities
One of Tableau’s biggest strengths is its ability to connect seamlessly with existing enterprise data systems while respecting established governance frameworks. By integrating all marketing channels into a single dashboard, it eliminates the problem of data silos and creates a cohesive view of business performance.
The platform supports connections to various data sources, including CRM systems, financial tools, and marketing platforms, through its advanced data integration and transformation features. For businesses needing more advanced analytics, Tableau integrates with Python and R, and it also offers native support for Salesforce Einstein Discovery, enabling AI-driven insights.
Andrew Richardson, Vice President of Analytics and Marketing Science at Tinuiti, highlights the platform’s impact:
"If we didn’t have Tableau, we would be behind where we are today and need more staff to do the same amount of work. These consumable, dynamic dashboards are making a really big difference for us and our customers."
To get the most out of Tableau, businesses should connect it to a centralized, governed data layer, such as a data warehouse or lakehouse. This setup ensures a single source of truth for marketing data and provides a strong foundation for real-time performance tracking.
Real-Time Analytics and Reporting
Tableau offers instant insights into operations, customer behavior, and market trends. This real-time access empowers marketing teams to adapt quickly to changes, seize new opportunities, and resolve issues as they arise.
By connecting to live databases, Tableau keeps visualizations up to date automatically, enabling users to monitor trends effortlessly. The platform can also trigger automated alerts when anomalies or specified thresholds are detected, ensuring teams can respond immediately.
A great example of this in action is Shopitize, a mobile retail app that uses Tableau to deliver real-time retail intelligence. With Tableau, the company has reduced its report generation time from days to mere minutes. Graham Halling, Commercial Director at Shopitize, explains:
"Tableau has become an integral part of our real-time actionable insights offering, which provides brands with a direct mobile channel to consumers. Tableau helps us learn about their behavior, and we provide consumers with targeted personalized offers based on these real-time learnings."
This capability ensures businesses can keep up with growing data demands while making informed decisions quickly.
Scalability for U.S.-Based Businesses
Tableau Server is designed to grow alongside businesses, offering both vertical scaling (adding processor power, memory, and storage) and horizontal scaling (adding more nodes to a cluster). This flexibility ensures better availability, increased capacity, and smoother performance as marketing operations expand.
The platform supports deployment across on-premises, virtual, and public cloud environments, including AWS, Azure, and Google Cloud. This makes it a suitable choice for any organization, whether a startup or a large enterprise.
The market reflects Tableau’s scalability. The Tableau Services market was valued at $1.3 billion in 2024 and is expected to grow to $5.8 billion by 2037, with an annual growth rate of 12.8%. North America is projected to lead the market, holding 42.6% of the revenue share by 2037, with large enterprises accounting for 65.4% of the market.
In March 2024, Salesforce enhanced Tableau Cloud’s scalability by integrating it with Hyperforce infrastructure, further boosting its ability to handle increasing data demands. To ensure optimal performance, businesses should maintain adequate server capacity, schedule data refreshes during off-peak hours, and follow visual best practices as their analytics needs grow.
8. Growth-onomics
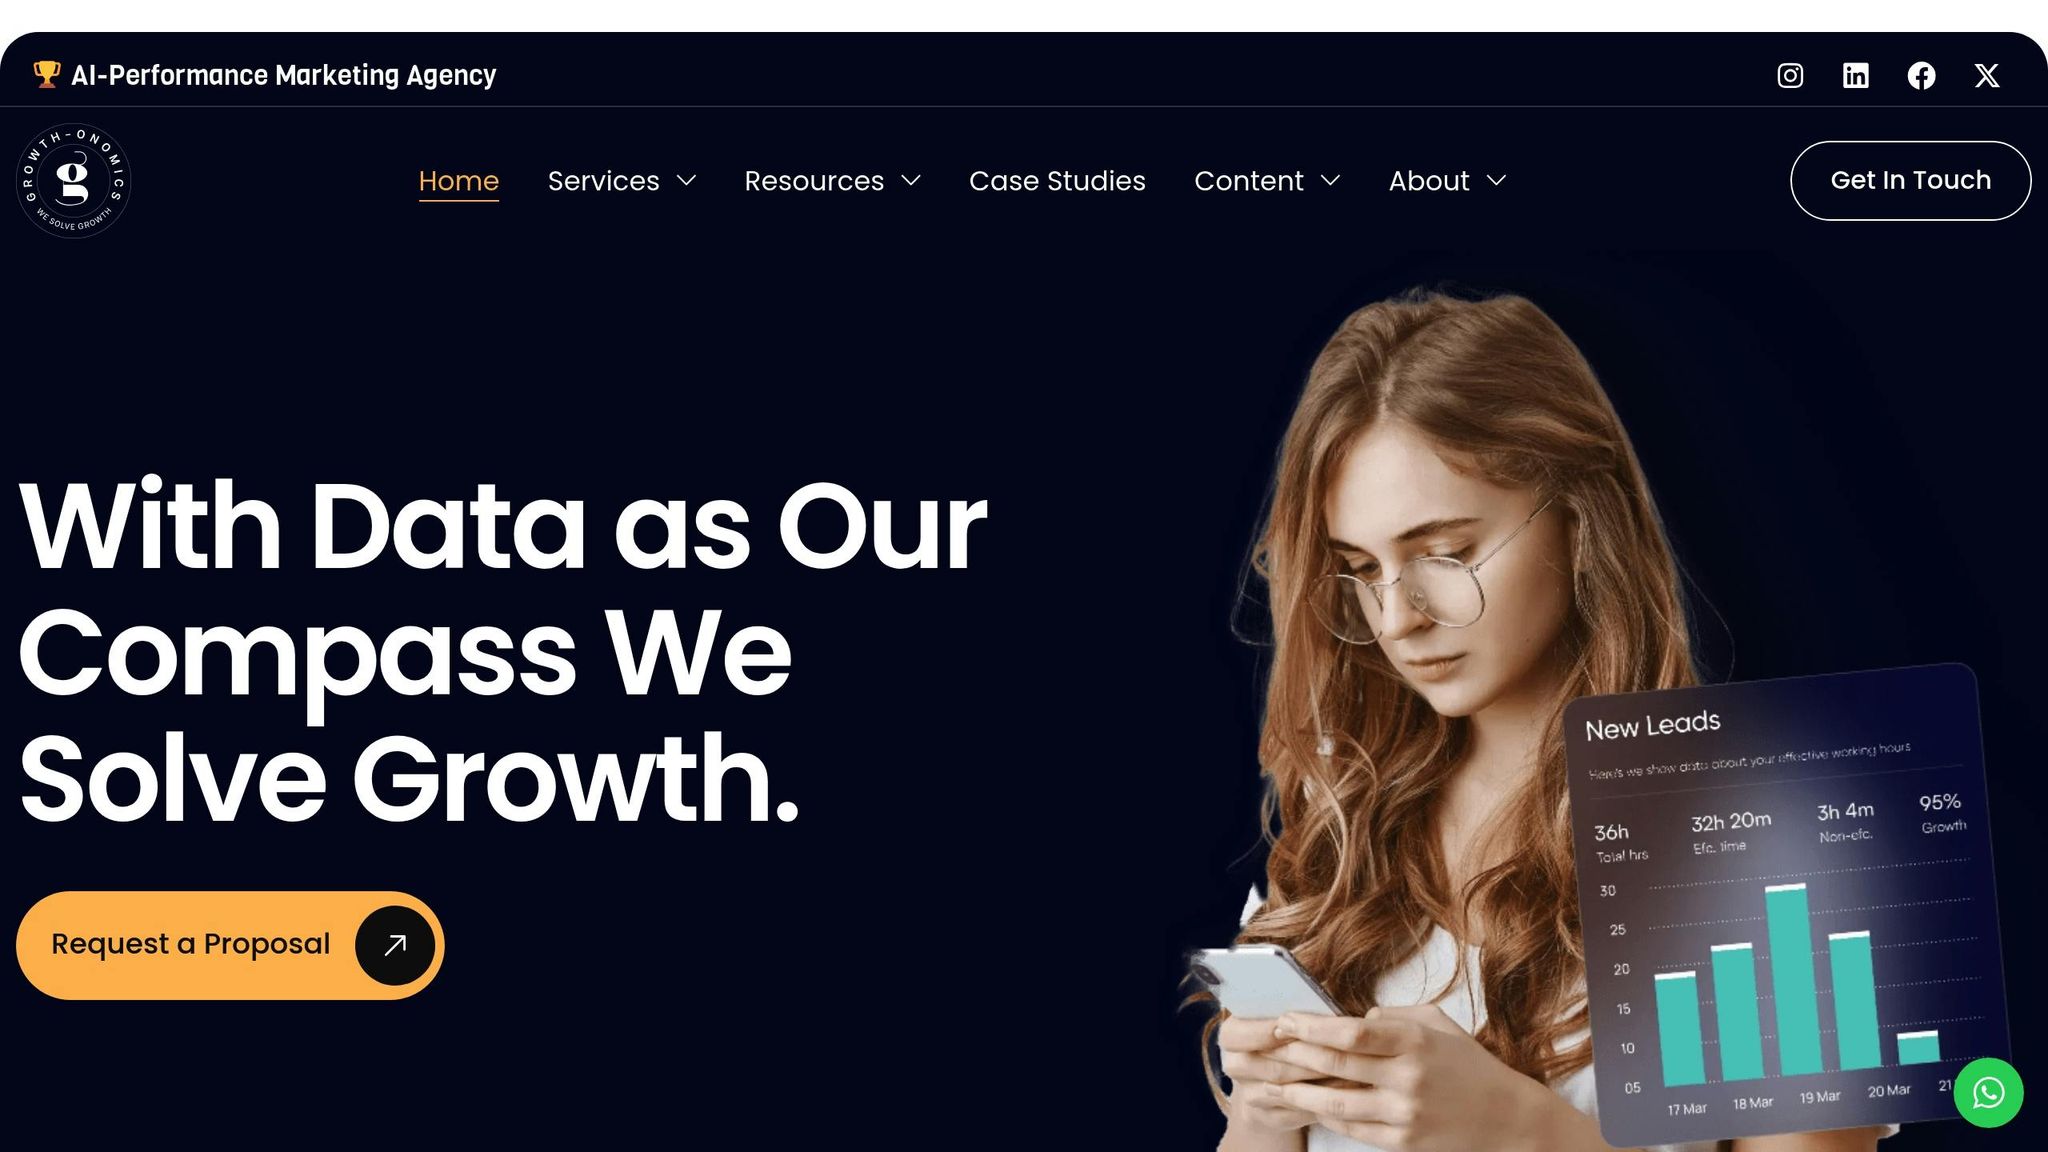
Growth-onomics is a performance marketing agency that turns multi-channel ROI measurement into a strategic edge. Instead of functioning as just another analytics tool, it brings together advanced data analysis and a growth-focused methodology to help U.S. businesses get the most out of their marketing budgets. Unlike typical analytics platforms, Growth-onomics offers a well-rounded strategy aimed squarely at driving growth.
At the heart of their approach lies a bold belief about the future of marketing:
"Traditional marketing model is dead. A growth-oriented business model is what comes next!"
This mindset fuels their emphasis on delivering actionable insights that directly contribute to business growth. Their unique approach focuses on data accuracy, real-time analytics, and seamless integration to help businesses move beyond surface-level metrics.
Data Accuracy and Attribution Models
One of the biggest hurdles in multi-channel ROI measurement is ensuring data accuracy, and Growth-onomics tackles this head-on. Poor data quality costs marketers 21 cents of every media dollar, while 60% of enterprise decision-makers remain unaware of the financial toll of bad data – estimated at $12.9 million annually. To address this, Growth-onomics employs machine learning–powered attribution models to identify the most impactful customer touchpoints using real, actionable data.
Their methodology dives deep into funnel analysis, A/B testing, personalization, omnichannel strategies, and campaign refinement. By ensuring attribution models reflect actual customer behaviors, they provide businesses with a clearer picture of what works. As Allison Borrow aptly puts it:
"Your programs are only as good as the data that goes into them."
By maintaining accurate and up-to-date customer data, Growth-onomics not only boosts marketing performance but also helps businesses stay compliant with data privacy laws.
Real-Time Analytics and Reporting
Accurate data is just the starting point – real-time analytics takes it further by enabling immediate campaign adjustments. Growth-onomics equips teams with tools to make on-the-spot, data-driven decisions. With 52% of marketers using multi-touch attribution (MTA) – and those users reporting greater satisfaction in tracking spending and allocating budgets – Growth-onomics positions businesses to thrive in this space. They even incorporate generative AI to deliver real-time insights into conversion pathways.
Their philosophy stresses the importance of regularly updating attribution models. This ensures the models stay relevant as audience behaviors and marketing strategies evolve. Their guiding principle sums it up best:
"With Data as Our Compass We Solve Growth"
Integration Capabilities
Growth-onomics also excels at integration, working seamlessly with existing marketing tools. Their data-driven and results-oriented approach uses trusted technologies to create a unified view of performance across all channels. By breaking down data silos, they help businesses overcome one of the biggest barriers to effective multi-channel ROI measurement.
Tool Comparison Table
Choosing the right multi-channel ROI measurement tool means weighing features, target users, and specific benefits. Below is a breakdown of popular tools, highlighting their strengths and relevance for U.S. businesses.
| Tool Name | Key Features | Best For | Main Benefit | U.S. Relevance |
|---|---|---|---|---|
| Google Analytics 4 | Website traffic monitoring, user behavior analysis, conversion pathways | Small to medium businesses starting with ROI measurement | Free analytics with detailed reporting | Essential for tracking website performance and marketing impact on sales |
| Adobe Analytics | Real-time analytics, advanced segmentation, JavaScript tracking across channels | Enterprise-level businesses with complex data needs | Tracks performance across email, social, and mobile apps | Ideal for large U.S. corporations managing multiple customer touchpoints |
| HubSpot Marketing Hub | Lead generation reports, customer interaction tracking, campaign analysis | B2B companies focused on lead nurturing | Offers insights into customer interactions and campaigns | Starting at $800/month, great for growing U.S. businesses prioritizing leads |
| Segment | Customer data unification, single customer view creation | Businesses managing fragmented data | Simplifies attribution by consolidating customer data | Addresses challenges of connecting disparate data sources in the U.S. market |
| Rockerbox | Multi-touch attribution, cross-channel performance tracking | Mid-market companies needing advanced attribution | Provides sophisticated modeling for complex journeys | Flexible pricing fits diverse U.S. business sizes |
| Mixpanel | Multi-channel attribution, conversion rate analysis, competitive pricing | Startups and growing companies seeking affordable solutions | Offers insights into channel impact on conversions | Delivers strong functionality at lower costs for U.S. businesses |
| Tableau | Advanced data visualization, customizable dashboards, predictive analytics | Data-driven organizations with complex reporting needs | Turns complex ROI data into actionable visuals | Helps U.S. businesses make clear, data-driven decisions |
| Growth-onomics | Machine learning attribution, real-time analytics, seamless integration | Businesses seeking a strategic growth partnership | Combines advanced analysis with a growth-focused approach | Supports U.S. businesses aiming for strategic, data-driven growth |
While features matter, pricing, integration capabilities, and real-time analytics can be deal-breakers for many U.S. businesses. For example, Google Analytics 4 offers a free entry point, making it accessible to smaller operations, while enterprise-focused tools like Adobe Analytics require custom pricing. HubSpot Marketing Hub’s $800/month starting price appeals to small businesses focused on lead generation, while Growth-onomics emphasizes long-term growth strategies over cost.
Some tools, like Segment, shine in unifying data from multiple sources, whereas others, like Growth-onomics, prioritize seamless integration with existing marketing tools. Real-time analytics is another critical factor – Adobe Analytics and Growth-onomics stand out for delivering instant insights that allow businesses to tweak campaigns on the fly, a must-have for time-sensitive marketing efforts in the U.S.
Ultimately, the best tool depends on your business size and goals. For beginners, Google Analytics 4 or HubSpot Marketing Hub are excellent starting points. Larger organizations with complex attribution needs may find Adobe Analytics or Growth-onomics better suited to their requirements.
Conclusion
In today’s complex marketing landscape, multi-channel ROI measurement is no longer optional for U.S. businesses. With customers engaging across an average of eight or more touchpoints before making a purchase, and 63% of businesses struggling to track campaign performance effectively, the need for sophisticated measurement tools is clear.
The trend toward data-driven decision-making is gaining momentum. By 2026, around 65% of businesses are expected to fully embrace this approach. Why? Because companies that prioritize data-driven strategies often see up to 8× higher ROI compared to their peers. Additionally, marketers who actively measure ROI tend to secure 1.6× more budget, and 73% of businesses now require comprehensive ROI tracking for every campaign.
Choosing the right ROI measurement tool has become a strategic decision, especially as privacy regulations reshape how data is collected and analyzed. Businesses must prioritize tools that emphasize first-party data collection and adhere to privacy-by-design principles. These tools not only ensure robust data protection but also provide the analytical depth required to truly understand campaign performance.
Data analytics continues to be a game-changer. Companies leveraging these tools are 2.2× more likely to rank as top performers, and adopting an omnichannel marketing strategy can boost customer retention by as much as 90% compared to single-channel approaches. Advanced tools don’t just improve targeting; they also enhance customer experiences and deliver the measurable ROI that businesses demand.
To succeed, businesses need to set clear goals, integrate data from all channels, and commit to continuous testing and refinement. Whether you’re a startup maximizing the value of Google Analytics 4 or a large enterprise utilizing advanced platforms like Adobe Analytics or Growth-onomics, aligning your tool choice with your unique objectives is critical for long-term growth.
The future belongs to businesses that can measure, analyze, and optimize their marketing investments across every channel. With AI and machine learning now pivotal for ROI tracking and innovations like IoT integration on the horizon, investing in the right tools today lays the groundwork for sustained competitive advantage.
FAQs
How can I choose the best multi-channel ROI measurement tool for my business goals and size?
Choosing the best multi-channel ROI measurement tool boils down to your business’s size, objectives, and technical requirements. If you’re running a small business, focus on tools with easy-to-navigate dashboards and basic attribution capabilities that make tracking and analysis straightforward. On the other hand, larger businesses or those juggling complex campaigns should look for platforms that provide real-time data insights, multi-channel attribution, and predictive analytics to stay ahead.
The key to finding the right tool is aligning its features with your performance metrics and campaign goals. This way, you can accurately measure ROI and make smarter decisions to fuel growth. Also, keep your team’s technical skills in mind – choose a tool that fits their expertise to ensure smooth adoption and efficient use.
What are the benefits of using real-time analytics for measuring ROI across multiple channels?
Real-time analytics brings a host of advantages when it comes to tracking ROI across various marketing channels. One of the standout benefits is the ability to make immediate adjustments to campaigns, fine-tuning strategies on the go to get the most out of your marketing budget. This means businesses can quickly spot what’s working, cut back on what isn’t, and use their resources more wisely.
Another big plus? Real-time data paves the way for tailored customer experiences. By understanding audience behavior as it happens, businesses can connect with their customers in ways that feel more relevant and engaging. The result? Smarter decisions, happier customers, and a boost in revenue.
How do attribution models improve the accuracy of ROI measurement across multiple marketing channels?
Attribution models are essential for better understanding ROI measurement. They assign value to each interaction a customer has during their journey, helping businesses pinpoint which marketing channels are driving conversions and contributing to overall success.
With the right attribution models in place, marketers can minimize bias, make smarter resource allocation decisions, and fine-tune strategies to get the most out of their efforts. This creates a more dependable, data-backed way to assess performance across various channels.