
Want to know if your social media strategy is hitting the mark? Here’s a quick breakdown of the key benchmarks for 2026:
- Engagement Rates:
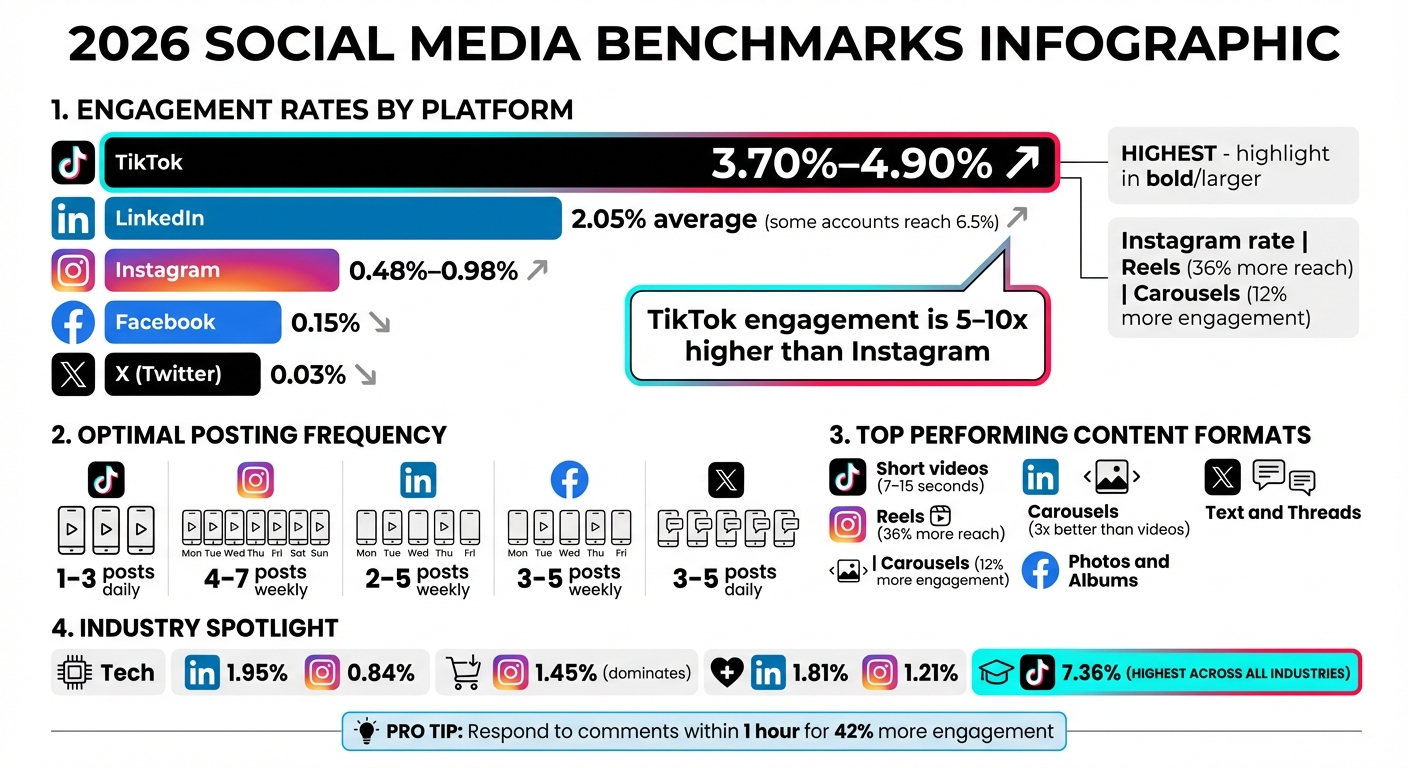
- TikTok leads with 3.70%–4.90%, while Instagram lags behind at 0.48%–0.98%.
- LinkedIn performs well for B2B, averaging 2.05%, with some accounts reaching 6.5%.
- Facebook and X (formerly Twitter) trail at 0.15% and 0.03%, respectively.
- Posting Frequency:
- TikTok thrives on 1–3 posts daily.
- Instagram: 4–7 posts weekly; LinkedIn: 2–5 posts weekly.
- Facebook: 3–5 posts weekly; X: 3–5 posts daily.
- Content Formats:
- TikTok: Short videos (7–15 seconds).
- Instagram: Reels (36% more reach) and carousels (12% more engagement).
- LinkedIn: Carousels outperform videos by 3x.
Industry-Specific Highlights:
- Tech: LinkedIn engagement at 1.95%; Instagram at 0.84%.
- Retail: Instagram dominates with 1.45% engagement.
- Healthcare: Instagram at 1.21%; LinkedIn at 1.81%.
- Education: TikTok engagement tops at 7.36%, the highest across all industries.
Benchmarks are a helpful guide, but tracking your own month-to-month growth is what truly matters. Focus on strategies that work for your audience and platforms.
2026 Social Media Engagement Rates and Posting Frequency by Platform
Overall Social Media Benchmarks for 2026
Engagement Rates by Platform
TikTok continues to dominate engagement metrics with an impressive average rate of 3.70%, marking a 49% year-over-year increase. Some reports even show engagement reaching 4.90%. In comparison, Instagram’s engagement ranges from 0.48% to 0.98%, putting TikTok’s performance at a staggering 5–10 times higher. Facebook trails behind with a modest 0.15% average engagement rate, while LinkedIn posts a stronger 2.05% on average, with some data suggesting medians as high as 6.5%.
Twitter, now branded as X, showed slight recovery with an engagement rate of 0.03% in 2025, doubling its 2024 figure of 0.015%. However, as Julian Winternheimer, Data Lead at Buffer, points out:
"The dramatic changes in some metrics – particularly X’s 44% increase… likely reflect changes in the user base or metric definitions rather than genuine performance improvements".
Here’s a breakdown of engagement trends over the past four years:
| Platform | 2023 Engagement | 2024 Engagement | 2025 Engagement | 2026 Engagement |
|---|---|---|---|---|
| TikTok | 4.07% | 4.40% | 4.64% | 4.90% |
| 1.16% | 1.05% | 1.01% | 0.98% | |
| 0.06% | 0.06% | 0.06% | 0.07% | |
| X (Twitter) | 0.05% | 0.04% | 0.04% | 0.03% |
(Source: Creaticalc 2026 Benchmark Report)
Another notable trend is the decline in user comments. On TikTok, comments per post have dropped by 24%, while Instagram has seen a 16% decrease. This shift suggests users are engaging passively – watching and liking content – but are less inclined to start conversations.
Posting Frequency and Content Formats
Engagement isn’t just about rates; posting frequency and content formats play a huge role in performance. LinkedIn performs best with 2 to 5 posts per week, while Instagram sees optimal results with 4 to 7 posts weekly. TikTok thrives on consistency, favoring 1 to 3 posts daily. Facebook benefits from 3 to 5 posts per week, and X demands a higher frequency of 3 to 5 posts daily to stay visible.
Content format preferences also vary by platform. On LinkedIn, PDF carousels outperform other formats, driving a median engagement of 21.77% – three times higher than videos or images. Instagram operates almost like two separate platforms: Reels deliver 36% more reach than carousels, while carousels generate 12% more engagement. TikTok, on the other hand, sticks to its roots, favoring short-form videos between 7 and 15 seconds for maximum impact.
| Platform | Posting Frequency | Top Performing Content Format |
|---|---|---|
| 2–5 times per week | Carousels / PDF Documents | |
| 4–7 times per week | Reels and Carousels | |
| TikTok | 1–3 times per day | Short-form Video (7–15s) |
| 3–5 times per week | Photos and Albums | |
| X (Twitter) | 3–5 times per day | Text and Threads |
(Source: Aggregated from Creaticalc and Buffer 2026 data)
Timely interaction can also make a big difference. Responding to comments within the first hour boosts engagement by 42% on Threads and 30% on LinkedIn.
Up next, we’ll explore how these benchmarks vary across industries to provide more tailored insights.
sbb-itb-2ec70df
2026 Social Media Benchmarks – What to expect this year
Social Media Benchmarks by Industry
Social media performance varies widely across industries. What works for a tech company might not resonate with a healthcare provider or retail brand. Knowing these distinctions can help you set realistic expectations and tailor your strategies to meet industry norms. Here’s a breakdown of benchmarks to guide your approach.
Technology Industry
Tech brands experience moderate engagement across social platforms. Instagram engagement averages 0.84%, while LinkedIn performs better at 1.95%. Facebook trails behind with just 0.15% engagement. Most tech companies post 3–4 times a week on Instagram, often featuring product demos, how-to content, and trend analyses.
LinkedIn is especially important for tech companies targeting B2B audiences. Popular formats include Reels, carousels, and product demonstrations that highlight solutions for key decision-makers.
Retail and E-commerce
Retail brands shine on visually driven platforms, with Instagram engagement at 1.45% – a strong indicator of the power of product design and conversion-focused strategies. Facebook engagement is slightly higher than tech at 0.16%. Retailers excel when they combine product showcases with lifestyle imagery, creating aspirational content that drives sales.
E-commerce brands tend to post more frequently than other industries, averaging 5.56 Instagram posts per week. Their feeds often feature user-generated content (UGC), lifestyle visuals, and product highlights to engage and convert their audience.
Healthcare Industry
Healthcare brands achieve 1.21% engagement on Instagram and 0.24% on Facebook, with LinkedIn engagement averaging 1.81%. Educational posts, patient testimonials, and health awareness campaigns perform well, helping these brands establish authority and trust. Topics like health tips, medical advice, and success stories dominate their content, all while adhering to strict compliance regulations.
Financial Services
Engagement in financial services ranges from 0.67% on Instagram to 1.75% on LinkedIn. Some studies report Instagram engagement as high as 3.8% per post, depending on measurement methods. Financial brands thrive on market insights, regulatory updates, and educational posts. For example, LinkedIn carousels are often used to simplify complex financial topics into easy-to-digest slides, reinforcing trust and meeting compliance standards.
Education and Agency Sectors
Higher Education leads the pack in engagement, boasting a 7.36% TikTok rate – the highest across all industries and platforms. Tim Eisenhauer from Apaya highlights this achievement:
"Higher Education at 7.36% is the single highest engagement rate in the entire dataset, across any industry and any platform".
On Instagram, educational institutions see 2.10% engagement, while Facebook engagement is 0.31%. Content that highlights student life, campus events, and aspirational moments like graduations fosters an emotional connection with prospective students, current students, and alumni alike.
Professional agencies also perform well, with LinkedIn engagement at 3.7% and Instagram at 3.4%. They focus on thought leadership, case studies, and actionable industry insights to demonstrate expertise and attract clients.
| Industry | Instagram Engagement | Facebook Engagement | LinkedIn Engagement | Best Content Formats |
|---|---|---|---|---|
| Technology | 0.84% | 0.15% | 1.95% | Product demos, Reels, Carousels |
| Retail/E-commerce | 1.45% | 0.16% | 3.9% | Product showcases, UGC, Lifestyle |
| Healthcare | 1.21% | 0.24% | 3.3% | Educational content, Patient stories |
| Financial Services | 0.67% | 0.04% | 1.75% | Market insights, Educational posts |
| Higher Education | 2.10% | 0.31% | 2.8% | Campus life, Student highlights |
| Agencies | 3.4% | 1.70% | 3.7% | Case studies, Thought leadership |
Social Media Trends and Strategies for 2026
LinkedIn’s Growth in B2B Marketing
LinkedIn is proving to be a game-changer in B2B marketing strategies. From Q3 2024 to Q3 2025, LinkedIn budgets grew by an impressive 31.7%, far outpacing Google’s modest 6% increase. This shift highlights a change in focus among marketers. Instead of zeroing in on lead generation – which dropped from 53.9% to 39.4% of campaign share – there’s now a stronger emphasis on brand awareness and engagement, which rose from 17.5% to 31.3%.
The platform’s impact goes beyond its own ecosystem. For example, accounts that align with an ideal customer profile (ICP) perform significantly better after LinkedIn ad exposure, converting 46% better in paid search and 43% better in outbound sales. As Vrushti Oza, Content Marketer at Factors.ai, puts it:
"LinkedIn is becoming the center of modern GTM because it influences buyers long before they enter a formal evaluation".
Visual content is another key driver of LinkedIn’s success. Carousels on the platform boast a median engagement rate of 21.77%, roughly three times higher than video or image posts. With 89% of B2B marketers using LinkedIn for lead generation and the platform accounting for 80% of all B2B social media leads, LinkedIn remains a critical hub for connecting with its 65 million business decision-makers. These trends suggest that visual and interactive content will play an even larger role in boosting engagement.
Short-Form Video and Visual Content
On Instagram, short-form video and carousel posts are driving the highest engagement rates. Carousels and Reels outperform static images by 44%. Each format has its strengths: Reels generate 36% more reach, making them ideal for discovery, while carousels secure 12% more engagement and consistently earn the highest number of saves. The advantage of carousels lies in their ability to appear twice per feed cycle, naturally increasing visibility and interaction.
Elena Cucu from Socialinsider emphasizes the importance of creating content that encourages action:
"Optimize for interaction, not visibility alone: formats that invite action (swipe, watch, save) consistently outperform passive consumption".
For a winning Instagram strategy in 2026, experts recommend dedicating 60–70% of content to Reels for discovery and 20–30% to carousels for building loyalty and encouraging saves. The growing importance of Reels is reflected in a 33% year-over-year increase in posting volume. To stand out, brands need not just creative content but also a focus on data-driven strategies.
Using Data-Driven Insights with Growth-onomics
Data is essential for fine-tuning social media strategies. Benchmarking against industry medians helps small businesses set realistic goals, spot performance gaps, and justify their budgets. Timely engagement also plays a big role: responding to comments within 60 minutes can boost engagement by up to 42% on Threads and 30% on LinkedIn. On the flip side, even a one-week break in posting can trigger a "no-post penalty", slowing growth significantly.
This is where Growth-onomics comes in. By using data analytics and performance marketing, businesses can identify patterns, optimize posting schedules, and refine content formats. Interestingly, smaller accounts (those with fewer than 10,000 followers) often see higher engagement rates, making these data-driven adjustments even more impactful for emerging brands. Moving forward, success will depend on tailoring strategies to each platform rather than applying a one-size-fits-all approach.
Conclusion
Industry benchmarks are the backbone of effective social media strategies. Without them, you’re essentially navigating without a map, comparing your healthcare brand’s results to metrics from a lifestyle influencer. As Shea Karssing from Buffer explains:
"Social media benchmarks act like a compass for your strategy. They show how your posts, engagement, and posting frequency compare to similar accounts, helping you understand what ‘good’ looks like without the guesswork".
To make the most of benchmarks, strategies need to be tailored to individual platforms. The 2026 data highlights one undeniable truth: platform-specific approaches outperform one-size-fits-all strategies every time. Interestingly, small to medium-sized businesses often have an edge here – accounts with fewer than 10,000 followers tend to achieve higher engagement rates than their larger competitors. By focusing on platform-specific metrics, businesses can direct their resources to where they deliver the best results.
The real strength of benchmarks becomes evident when paired with your own month-over-month performance data. Tim Eisenhauer from Apaya sums it up perfectly:
"Your engagement rate this month compared to last month – that tells you everything. That’s the only benchmark worth losing sleep over".
While industry averages provide a useful reference, your internal growth trends should be the guiding force behind your strategy.
This is where data-driven insights shine. Tools like Growth-onomics help small and medium-sized businesses make sense of raw social media data, turning it into actionable strategies. They reveal which platforms deserve your budget, the ideal times to post, and the content formats that drive real business outcomes. After all, a 1% engagement rate that generates qualified leads is far more valuable than a 5% rate that doesn’t translate into results.
Success in 2026 boils down to three key actions: understanding your industry benchmarks, tracking your own performance consistently, and adapting your strategy based on actual data – not wishful thinking.
FAQs
How do I calculate my engagement rate correctly?
To figure out your engagement rate, take the total number of interactions – like likes, comments, and shares – and divide it by either your total followers or your reach, depending on the platform you’re analyzing. Then, multiply that result by 100 to express it as a percentage. If you’re looking at engagement for a specific post, only use the interactions from that post in your calculation.
Engagement benchmarks differ across platforms. For example, on X (formerly Twitter), engagement rates hover around 0.03%, while TikTok often sees rates exceeding 5%. Keep in mind that both the platform and the size of your audience play a big role in determining what qualifies as a good engagement rate.
Which metric matters most if my goal is leads or sales?
The conversion rate stands out as the key metric for generating leads or driving sales. It reflects how well your social media efforts are transforming visitors into customers or potential prospects. This makes it a crucial measure of your overall success.
How should I adjust benchmarks for a small account under 10,000 followers?
For accounts with fewer than 10,000 followers, engagement rates often stand out. Nano and micro accounts typically achieve 4-6% engagement on Instagram and 8-12% on TikTok. Use these averages as a benchmark to evaluate your performance, keeping in mind how your account size and audience interaction might influence these numbers.