Every quarter, some B2B SaaS team discovers that their cheapest campaign is their most expensive one.
The display campaign delivering leads at a quarter of the cost of branded search looks like the obvious winner right up until someone filters the CRM by opportunity. Then the picture inverts: hundreds of cheap conversions, a handful of sales-qualified leads, and a cost per SQL several times worse than the campaign everyone wanted to cut.
That inversion is the central fact of B2B paid search. Cost per lead and cost per SQL rank campaign types in almost opposite orders, because the campaigns that produce cheap conversions are the ones reaching people who are not buying anything.
Optimizing to the first number reliably makes the second one worse.
This ranking is ordered by cost per SQL rather than cost per lead, based on how closely each campaign type maps to purchase intent and how much waste is structurally built into it.
There is one caveat to be aware of: there is no universal benchmark here, and any article quoting one is describing somebody else’s account. Your numbers depend on category competitiveness, contract value, sales motion, and how honestly your CRM records qualification. What transfers is the ordering and the reasoning behind it.
Why Cost per Lead Ranks These Backwards
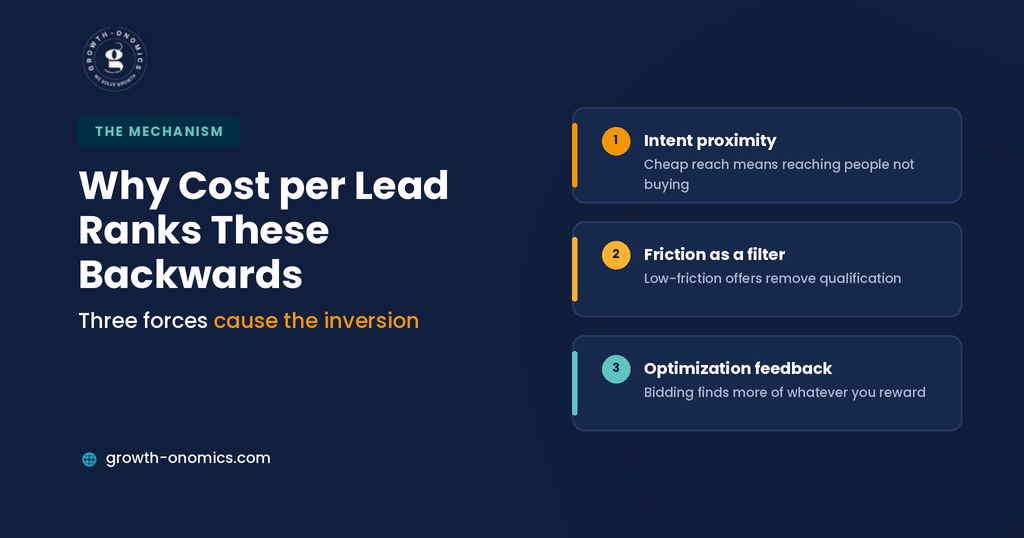
3 structural forces explain the inversion, and understanding them makes the ranking predictable rather than surprising.
Intent proximity. Someone searching your competitor’s name plus “alternatives” is mid-evaluation. Someone shown a display banner while reading news is not thinking about your category at all. The cost of reaching the second person is far lower, and so is the probability that reaching them matters.
Conversion friction as a filter. Cheap campaigns typically convert on low-friction offers: an ebook, a webinar, a newsletter. That friction gap is doing qualification work. Removing it does not create demand; it creates form fills from people who would never have booked a demo.
Optimization feedback. Automated bidding optimizes toward whatever conversion event you defined. Feed it form fills and it becomes extremely good at finding people who fill in forms. This is the mechanism by which a campaign gets cheaper per lead and worse per SQL at the same time, and it accelerates the longer it runs.
The practical consequence is that campaign selection has less impact than what you optimize toward. A poorly chosen campaign type fed qualified-opportunity data will outperform a well-chosen one optimizing to raw conversions.
Growth-onomics treats offline conversion import as prerequisite work in paid engagements for exactly this reason until the platform learns what a good lead looks like, every campaign in this ranking performs worse than it should.
That also explains why account audits so often find the same pattern: a well-structured account with sensible campaign types, generating leads nobody in sales wants, because the only signal ever sent back to Google was a form submission.
Quick Comparison
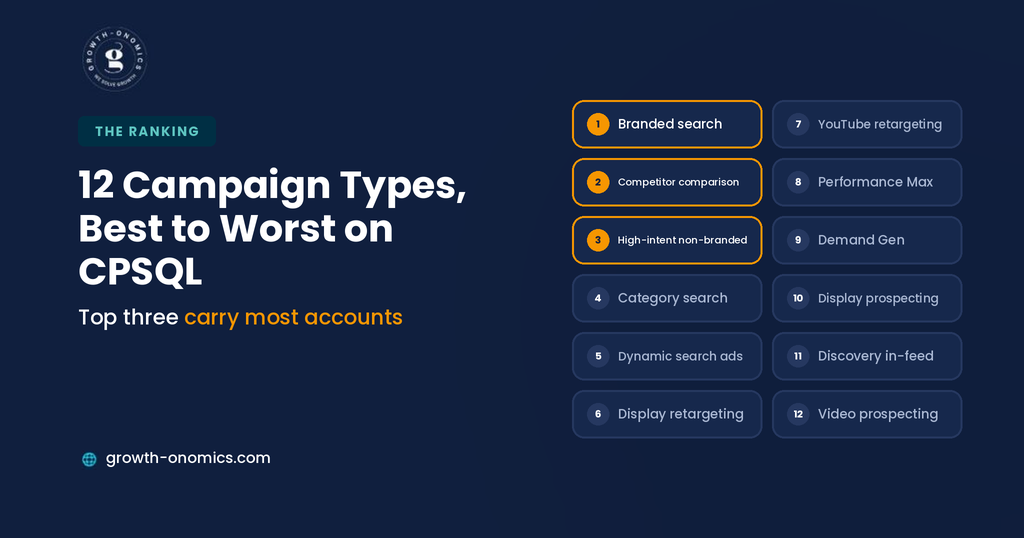
| Rank | Campaign Type | Intent | Typical CPL vs CPSQL |
| 1 | Branded search | Highest | High CPL, lowest CPSQL |
| 2 | Competitor comparison | Very high | High CPL, low CPSQL |
| 3 | High-intent non-branded | High | High CPL, competitive CPSQL |
| 4 | Category and solution search | Moderate | Moderate both |
| 5 | Dynamic search ads | Variable | Low CPL, variable CPSQL |
| 6 | Retargeting on display | Warm | Low CPL, moderate CPSQL |
| 7 | YouTube retargeting | Warm | Low CPL, moderate CPSQL |
| 8 | Performance Max | Mixed | Low CPL, opaque CPSQL |
| 9 | Demand Gen | Low | Low CPL, high CPSQL |
| 10 | Broad display prospecting | Very low | Lowest CPL, highest CPSQL |
| 11 | Discovery and in-feed | Very low | Low CPL, high CPSQL |
| 12 | Video prospecting | Lowest | Low CPL, rarely measurable |
1. Branded Search
Intent: Someone typing your name is already considering you.
Why It Ranks First
The highest conversion rate and the shortest path to an opportunity of anything in the account. It also protects the demo request from competitors bidding on your brand, which most categories now do routinely.
The Objection Worth Taking Seriously
The standard argument against branded is that you would win those clicks organically for free. Partly true; you cannibalize some organic clicks. But brand searches increasingly arrive after AI-assisted research, which means competitors appear alongside you at the exact moment a buyer has decided to look you up. Ceding that position is a different decision than it was 3 years ago.
Where It Misleads
Branded campaigns take credit for demand generated elsewhere: content, PR, word of mouth, and increasingly AI-assisted research. Report them separately from acquisition campaigns, or your blended cost per SQL will flatter an acquisition programme that’s not working.
2. Competitor Comparison Search
Intent: Actively evaluating alternatives to a named competitor.
Why It Ranks Second
The highest-intent non-branded traffic available. Someone searching “[competitor] alternatives” has decided to leave and is choosing where to go, which is a shorter journey to an opportunity than any category query.
What Makes It Work
A genuine comparison or alternatives landing page rather than a homepage. The ad promises a comparison; sending traffic to a generic page wastes the intent and drives cost per SQL up sharply.
Where It Misleads
Click costs are high, and quality scores are poor, since your landing page will never be as relevant to a competitor’s brand term as their own. Judge it on cost per SQL rather than CPC, or you will pause a working campaign for looking expensive.
3. High-Intent Non-Branded Search
Intent: Searching for the specific job your product does, with commercial modifiers.
Why It Ranks Third
Terms containing “software,” “platform,” “tool,” “pricing,” or “for [role]” carry purchase intent rather than research intent. These are the queries that produce demos from people who were not already aware of you.
What Makes It Work
Tight ad groups mapped to specific landing pages, and aggressive negative keyword management. Most of the waste in this campaign type comes from adjacent queries that look commercial and are not.
Where It Misleads
These are the most expensive clicks in most SaaS categories, and the temptation is to broaden match types to reduce CPC. That reliably worsens cost per SQL, because broad matching pulls in the research queries you were avoiding.
4. Category and Solution Search
Intent: Researching approaches, not yet evaluating vendors.
Why It Ranks Mid-Table
Genuine demand exists here, but a significant share of the traffic is early-stage research that will not convert to an opportunity in the reporting window. It works when your sales motion can nurture, and underperforms when you need same-quarter pipeline.
What Makes It Work
A relevant, substantive landing page and realistic expectations. Treating these as demand capture rather than demand creation is the mistake that ruins the numbers.
Where It Misleads
Conversion rates look reasonable because people will download things. Qualification rates are much lower, and the gap only shows up once opportunity data flows back.
5. Dynamic Search Ads
Intent: Variable; Google matches queries to your page content.
Why It Ranks Here
Genuinely useful for discovering converting queries you had not thought of, and effective on large documentation or resource sites. Also capable of matching your careers page to job seekers if left unmanaged.
What Makes It Work
Restricting targeting to specific high-value page sets rather than the whole domain, plus a disciplined negative keyword list built weekly for the first month.
Where It Misleads
Reported performance often looks strong because DSA captures branded and near-branded queries that would have converted anyway. Exclude your brand terms before judging it.
6. Retargeting on Display
Intent: Previously engaged, now being reminded.
Why It Ranks Here
Cheap, and it does influence deals in long sales cycles by keeping you visible across a multi-month evaluation. Its problem is attribution rather than value.
What Makes It Work
Segmenting by page depth. Retargeting everyone who touched the blog produces noise; retargeting people who viewed pricing or a comparison page reaches an actual evaluation.
Where It Misleads
Retargeting takes credit for conversions that would have happened anyway, which is why it consistently looks better in platform reporting than in a holdout test. If you want the real number, run one; it is the cheapest incrementality test available, and it usually changes the budget conversation.
7. YouTube Retargeting
Intent: Previously engaged, reached through video.
Why It Ranks Here
Useful for complex products where a demonstration explains more than a banner can, particularly against site visitors who did not convert. Cost per view is low and the format suits explanation.
What Makes It Work
Short, specific creative addressing a known objection rather than a brand film. The audience already knows who you are.
Where It Misleads
View-through conversions inflate reported performance substantially. Report click-through conversions separately before drawing conclusions.
8. Performance Max
Intent: Mixed, and largely not visible to you.
Why It Ranks 8th Despite Strong Reported Numbers
PMax spans search, display, YouTube, Discover, Gmail, and Maps, optimizing toward your conversion goal across all of them. In B2B, it frequently reports excellent cost per lead by finding the cheapest conversions available, which are rarely the qualified ones. Limited search term visibility makes diagnosing that difficult.
What Makes It Work
Feeding offline conversion data so it optimizes toward opportunities rather than form fills, tight brand exclusions, and treating it as one channel among several rather than a consolidation of the account.
Where It Misleads
Without brand exclusions, it absorbs branded traffic and reports it as acquisition. This is the single most common way PMax flatters itself in a B2B account.
9. Demand Gen
Intent: Low, visual placements to audiences that were not searching.
Why It Ranks Here
It is genuinely capable of reaching relevant audiences at scale with strong creative, and it works for consumer-adjacent B2B products with broad appeal. For considered enterprise purchases, the intent gap is hard to close within a reporting period.
What Makes It Work
Realistic framing as an awareness investment measured on assisted influence and branded search lift rather than direct cost per SQL.
Where It Misleads
Reported conversions skew toward low-friction offers. Judging it on lead volume produces a decision to scale exactly the campaign that will dilute your pipeline quality.
10. Broad Display Prospecting
Intent: Very low, banners to audiences defined by interest or topic.
Why It Ranks Near the Bottom
The cheapest clicks and conversions in the account, and typically the worst cost per SQL by a wide margin. Interest-based targeting is a coarse proxy for buying intent in B2B, where the buying committee is small, specific, and rarely identifiable by content consumption.
What Makes It Work
Very little, in most B2B SaaS accounts. Where it does, it is usually narrow placement targeting on a handful of industry publications rather than broad audience targeting.
Where It Misleads
The CPL looks so good that it survives budget reviews for quarters. Filtering to opportunities is the check that ends the debate.
11. Discovery and In-Feed Placements
Intent: Very low, content-consumption context.
Why It Ranks Here
Similar dynamics to display with better creative formats and slightly better audience signals. Still fundamentally interruption at a moment unrelated to purchase.
What Makes It Work
Content offers rather than demo requests, with the honest expectation that you are filling the top of a nurture sequence rather than generating pipeline.
Where It Misleads
Engagement metrics are flattering. Time on site and scroll depth do not predict qualification.
12. Video Prospecting
Intent: Lowest, cold audiences reached through video.
Why It Ranks Last
Cheap views, minimal measurable pipeline impact within a typical reporting window, and the hardest attribution of anything in the account. For B2B SaaS below enterprise scale, budget almost always produces more return elsewhere.
What Makes It Work
Brand-building objectives with a multi-quarter horizon and a measurement approach based on branded search lift or incrementality testing rather than direct response.
Where It Misleads
View counts and completion rates feel like performance. They are not, and presenting them as marketing results invites the scrutiny that follows.
What Moves Cost per SQL
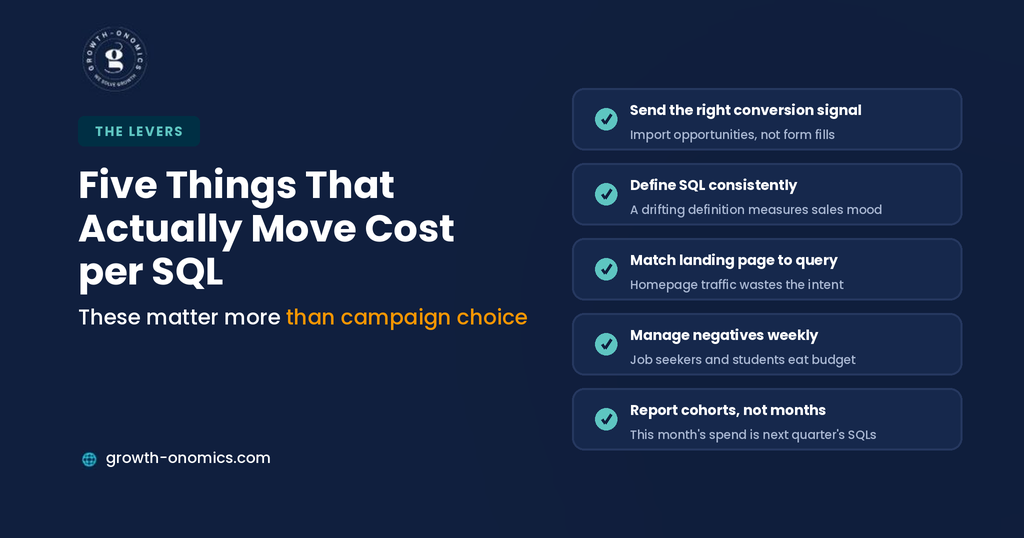
The ranking sets your ceiling. 5 decisions determine where you land within it, and they weigh more than campaign selection.
Send the platform the right conversion signal. Import opportunity and closed-won data back to Google against the original click identifier. Automated bidding optimizing toward form fills will find form fills, and no campaign structure survives that.
Define SQL consistently. Cost per SQL is only meaningful if qualification is applied the same way every month. If your definition drifts with pipeline pressure, the metric measures sales mood rather than campaign performance.
Match the landing page to the query. Competitor terms need a comparison page, category terms need an explainer, high-intent terms need a product page. Homepage traffic from a specific query is the most common preventable waste in a B2B account.
Manage negatives relentlessly. Job seekers, students, competitors, and adjacent industries account for a large share of wasted spend in most accounts, and the list needs weekly attention early in a campaign’s life.
Report cohorts, not months. With a 90-day cycle, this month’s spend produces next quarter’s SQLs. Comparing them in the same period will make your best campaigns look like your worst. Growth-onomics reports paid performance on cohort windows agreed with finance in advance, because retrofitting that definition after a bad-looking month is where credibility gets lost.
Conclusion
The ranking in this article is not a recommendation to spend everything on branded search. It is an argument about sequencing: capture the demand that already exists, prove the measurement works, and expand outward into demand creation only when the feedback loop is trustworthy.
Most B2B SaaS accounts get this backwards. They start broad because the impressions are cheap and the leads look inexpensive, then spend two quarters wondering why pipeline did not follow. Working inside-out: brand, competitors, high-intent non-branded, then category produces a smaller account that generates more opportunities and a cost per SQL you can defend.
The rankings will also shift for your business. A product-led company with self-serve signup has different economics than an enterprise sales motion, and a category with expensive clicks and cheap contracts inverts several positions on this list. What holds is the underlying logic: intent proximity predicts qualification, conversion friction does qualification work, and whatever you optimize toward is what you will get more of.
If you want your paid programme measured against qualified pipeline rather than platform-reported conversions, Growth-onomics can audit the tracking and rebuild the reporting around it.
FAQs
What is a good cost per SQL for B2B SaaS?
There’s no benchmark worth quoting, and any figure presented as one describes a different business. Cost per SQL depends on contract value, category competitiveness, sales motion, and how strictly your team defines qualification; a company with a $50,000 average contract can justify a cost per SQL that would bankrupt one selling at $6,000. The useful comparison is internal: your own trend over consecutive quarters, and the relative performance between campaign types in your account using one consistent qualification definition. Benchmarks against other companies mostly produce arguments rather than decisions.
Should B2B SaaS companies bid on their own brand?
In most cases, yes, though the argument has become more nuanced. The cost is real cannibalization of clicks you might have won organically. The benefit is controlling the result when a competitor bids on your name, which most categories now see routinely. What has changed is that brand searches increasingly follow AI-assisted research, so a buyer typing your name has often just been given a shortlist that includes competitors. Ceding that moment is a bigger concession than it used to be. Test it with a holdout in one region before deciding.
Does Performance Max work for B2B SaaS?
It can, but it requires more governance than most accounts give it. PMax optimizes toward your conversion goal across Google’s inventory, and if that goal is a form fill, it will efficiently find the cheapest form fills available, which are rarely qualified in B2B. Feeding offline conversion data so it optimizes toward opportunities, applying tight brand exclusions so it does not absorb branded traffic and report it as acquisition, and running a holdout before migrating meaningful budget are the three things that separate a working PMax campaign from a flattering one.
How do I get opportunity data back into Google Ads?
Capture the click identifier at form submission, store it on the CRM record, and import conversion events back to Google when the opportunity is created, or the deal closes. Most CRMs support this natively or through a connector, and the technical work is modest. The hard part is organizational: it requires sales to maintain stages consistently, since the imported signal is only as good as the qualification behind it. This is prerequisite work rather than an optimization until it exists; every automated bidding decision in your account is optimizing against a proxy.
Should we run separate campaigns for each buyer persona?
Only where the search behaviour genuinely differs. Splitting by persona is worthwhile when different roles use different terminology and need different landing pages; a security lead and a finance lead searching for the same product often use vocabulary that shares no keywords. It is counterproductive when it fragments conversion volume across campaigns too small for automated bidding to learn from, which is the more common outcome in B2B. Start consolidated, watch the search term report for genuine language divergence, and split only when the data shows two distinct query sets.
How long should I wait before judging a campaign on cost per SQL?
At least one full sales cycle, and preferably two. With a 90-day cycle, a campaign launched in January produces opportunities that appear in April at the earliest, so a February performance review is reading conversion data rather than qualification data. Report cohorts spend from a given month tracked forward against the SQLs it eventually produced rather than comparing spend and SQLs within the same period. Use conversion volume and lead quality signals as early indicators in the meantime, but resist making budget decisions on them.