


2 SaaS companies publish 20 articles each in Q1. Both see organic sessions climb roughly 30%. By Q3, one has added meaningful pipeline and the other has added a line on a chart.
The difference was visible in the data months before it showed up in the CRM, and it was not in the traffic numbers. It was in which pages the traffic landed on, which queries brought it, how many of those visitors came from companies matching the ICP, and how many returned.
Every one of those signals moved before revenue did.
That is what a leading indicator is: something that changes early, correlates with the outcome, and can be acted on while there is still time. Sessions fail all 3 tests.
They move for reasons unrelated to buying intent, they correlate weakly with pipeline in B2B, and by the time you notice they went up, the content decisions that produced them were made 2 quarters ago.
These 10 metrics behave differently. Each one answers a question about whether organic search is producing qualified demand or just visitors, and each one moves early enough to change what you do next. A few require a CRM connection. Most do not.
Why Sessions Predict Almost Nothing
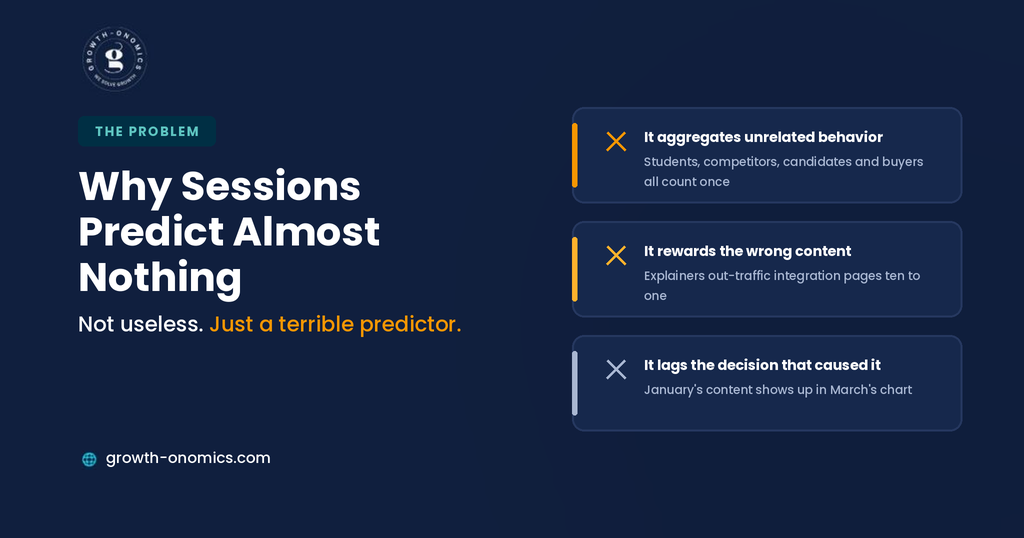
The session count is not a useless metric. It is a terrible predictor, and the two are different claims.
It aggregates unrelated behavior. A student researching a definition, a competitor checking your pricing, a candidate reading your careers page, and a VP of Operations comparing vendors all appear as one session each. Averaging them produces a number that describes nobody.
It rewards the wrong content. Top-funnel explainers generate more sessions than integration pages by an order of magnitude, and integration pages produce the demos. A team optimizing for sessions will systematically build the wrong things, and the dashboard will congratulate them for it.
It lags the decisions that caused it. Content published in January shows up in March traffic. By the time sessions move, the useful moment to intervene has passed.
The metrics below fix this in 3 ways: they narrow to buying-intent behavior, they weight for account fit rather than volume, and they measure things that move within weeks rather than quarters. Each entry states what it measures, how to build it, what the signal looks like, and where it misleads.
One framing note before the list. None of these replaces the pipeline number itself; they precede it. The point of a leading indicator is that it changes while you can still do something, which means accepting a weaker correlation in exchange for earlier warning.
Treat them as steering data and the lagging metrics as scoring.
Quick Comparison
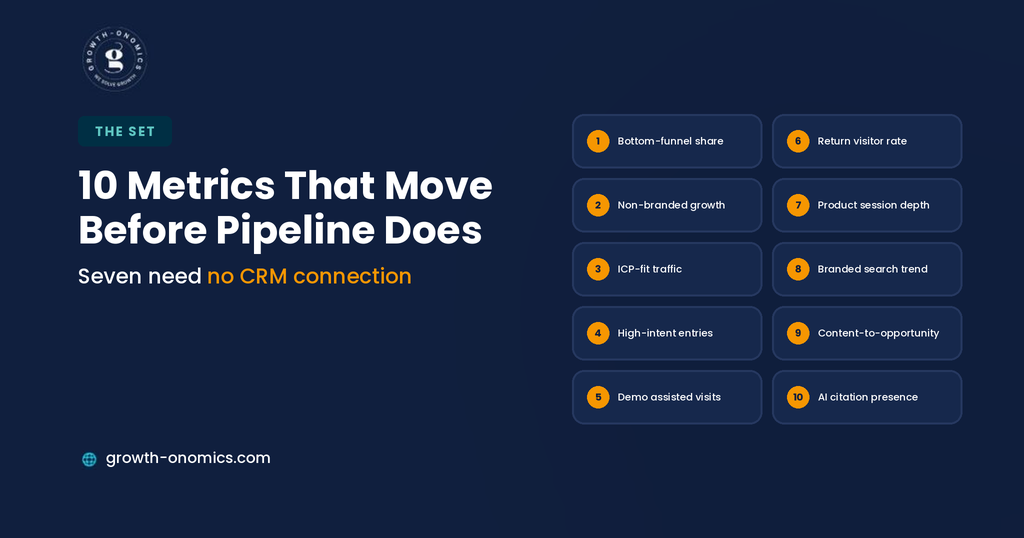
| # | Metric | Predicts | Data Needed |
| 1 | Bottom-funnel impression share | Future high-intent traffic | Search Console |
| 2 | Non-branded query growth | Net new demand | Search Console |
| 3 | ICP-fit traffic ratio | Qualified volume | Analytics + firmographic data |
| 4 | High-intent page entry rate | Purchase-stage arrivals | Analytics |
| 5 | Demo page assisted sessions | Conversion readiness | Analytics paths |
| 6 | Return visitor rate | Active evaluation | Analytics |
| 7 | Session depth on product content | Genuine research | Analytics |
| 8 | Branded search trend | Discovery beyond clicks | Search Console |
| 9 | Content-to-opportunity rate | Direct pipeline link | CRM + attribution |
| 10 | AI citation presence | Shortlist inclusion | Visibility tracking |
1. Bottom-Funnel Impression Share
What it measures: The proportion of impressions your site earns on commercial-intent queries like comparisons, alternatives, pricing, and integrations as a share of total impressions.
How to Build It
Tag your query set by funnel stage in Search Console, then track bottom-funnel impressions as a percentage of the total, monthly. The absolute number means less than the share, because share tells you whether your visibility is shifting toward or away from buying queries.
What the Signal Looks Like
Rising share means you are becoming visible where purchase decisions happen, and it typically precedes demo request growth by a quarter or more. Falling share while total impressions rise is the classic pattern of a content program drifting upward into vanity territory.
Where It Misleads
Impressions include positions nobody sees. Filter to queries where you rank in the top 20, or the metric rewards appearing on page 4, which is how a rising number can accompany falling clicks.
2. Non-Branded Query Growth
What it measures: Growth in impressions and clicks from queries that do not contain your brand or product names.
How to Build It
Define your brand terms carefully, including misspellings and product names, then split Search Console performance into branded and non-branded and track both monthly.
What the Signal Looks Like
Non-branded growth means new people are finding you who were not already looking. That is the definition of demand generation, and it is the number that separates a working content program from one riding brand campaigns.
Where It Misleads
Non-branded traffic to purely informational content is not demand generation either. Segment it by funnel stage, because non-branded growth concentrated in top-funnel explainers produces sessions rather than pipeline.
3. ICP-Fit Traffic Ratio
What it measures: The proportion of organic sessions from companies matching your ideal customer profile.
How to Build It
Requires firmographic enrichment; IP-to-company resolution through an attribution platform or a reverse IP tool joined to organic sessions. Compare the resulting company list against your ICP criteria for size, industry, and technology stack.
What the Signal Looks Like
This is the single strongest predictor on the list, because it answers the only question that is relevant about traffic quality. A page attracting fifty ICP-fit companies counts more than one attracting two thousand irrelevant sessions.
Where It Misleads
IP resolution identifies a share of company traffic, not all of it, and remote work has degraded accuracy considerably. Treat the ratio as directional rather than absolute, hold the ICP definition stable, and compare periods rather than reading any single number in isolation.
4. High-Intent Page Entry Rate
What it measures: The proportion of organic sessions that land directly on bottom-funnel pages like pricing, comparisons, integrations, security.
How to Build It
Classify your pages by funnel stage once, then report entry sessions to bottom-funnel pages as a share of total organic entries in your analytics platform.
What the Signal Looks Like
Someone arriving directly on a comparison page from search is deeper in evaluation than someone landing on a definition. Rising entry rate to these pages means your visibility is improving where decisions get made, and it moves within weeks of publishing or improving those pages.
Where It Misleads
The ratio can rise because top-funnel traffic fell rather than because bottom-funnel traffic grew. Always report the underlying volumes alongside the ratio.
5. Demo Page Assisted Sessions
What it measures: How often organic sessions include a visit to your demo, trial, or contact page, whether or not they convert on that visit.
How to Build It
Use path exploration in your analytics platform to count sessions that touched a conversion page, segmented by organic. Track which entry pages most often precede that visit.
What the Signal Looks Like
This is the closest behavioral proxy to intent available without CRM data. It also identifies your genuinely commercial content: the pages that repeatedly precede a demo page visit are your highest-value assets, regardless of what the traffic report says about them.
Where It Misleads
Visiting a pricing or demo page is not converting, and a rising rate with flat conversions points at a friction problem on the form rather than a content success.
6. Return Visitor Rate From Organic
What it measures: The share of organic visitors who return within a defined window, typically thirty days.
How to Build It
Segment returning users by organic acquisition in your analytics platform. Track the rate monthly and, where possible, split by landing page category.
What the Signal Looks Like
B2B buyers research over weeks and return repeatedly before acting. A rising return rate means people are actively evaluating rather than glancing and leaving, and it usually precedes conversion growth because it reflects the shape of the buying process.
Where It Misleads
Cookie restrictions and cross-device research understate returns significantly, so the absolute number is low everywhere. Watch direction instead of level.
7. Multi-Page Session Depth on Product Content
What it measures: Average pages per session for visitors who enter on product, integration, or use-case content.
How to Build It
Segment sessions by landing page category and report pages per session for the product-content segment specifically, rather than site-wide.
What the Signal Looks Like
Someone reading three integration pages is checking whether you fit their stack. Someone reading one blog post and leaving is not evaluating anything. Depth on product content is a reliable marker of genuine research, and it identifies which entry pages open a real session versus which are dead ends.
Where It Misleads
Site-wide pages-per-session is nearly meaningless, since blog readers and evaluators average out. The segmentation is what makes the metric work.
8. Branded Search Volume Trend
What it measures: Growth in searches for your brand and product names.
How to Build It
Track branded query impressions and clicks in Search Console, monthly, controlling for obvious confounders such as funding announcements, paid campaigns, and product launches.
What the Signal Looks Like
Branded search rising without a corresponding paid or PR push means people are learning about you somewhere else and then searching your name. Increasingly, that somewhere else is an AI assistant, which passes no referrer and leaves branded search as the only visible trace.
Where It Misleads
Correlation is not causation, and branded search rises for many reasons. Present it as supporting evidence within a picture rather than proof on its own. Growth-onomics pairs this trend with citation tracking for exactly that reason: branded lift alongside rising AI citations is a far more defensible read than either signal alone.
9. Content-to-Opportunity Rate
What it measures: The proportion of opportunities whose account journey includes a visit to a given content asset or content category.
How to Build It
Requires attribution connecting web sessions to CRM accounts. Report the count of opportunities influenced per page or category rather than a percentage-of-credit model, because influence counts are harder to dispute than attribution weights.
What the Signal Looks Like
The number that ends the board argument. It reframes the conversation from “organic sessions grew” to “these eleven pages appeared in the journeys of 43 opportunities last quarter,” which is a claim a CFO can engage with.
Where It Misleads
It is lagging rather than leading, given sales-cycle length, and it inherits your CRM hygiene entirely. Use it to validate the leading indicators rather than to replace them.
10. AI Citation Presence for Buying Questions
What it measures: Whether your brand appears when assistants answer the commercial questions in your category, which tool to choose, alternatives to a competitor, or whether you integrate with a given system.
How to Build It
Run a frozen set of buying-stage prompts across platforms at regular intervals and record mentions, citations, and how you are described. Track it separately from informational prompts, because presence in category explainers means little commercially.
What the Signal Looks Like
A leading indicator of shortlist inclusion. Buyers increasingly build their initial list in an assistant before visiting any vendor site, so being absent from those answers removes you from consideration invisibly: no impression, no click, no signal in any traditional report.
Where It Misleads
Results vary between runs and platforms, and the data is sampled rather than measured. Keep the prompt set frozen so trends mean something, and never report a single reading as a result.
Building a Leading Indicator Dashboard
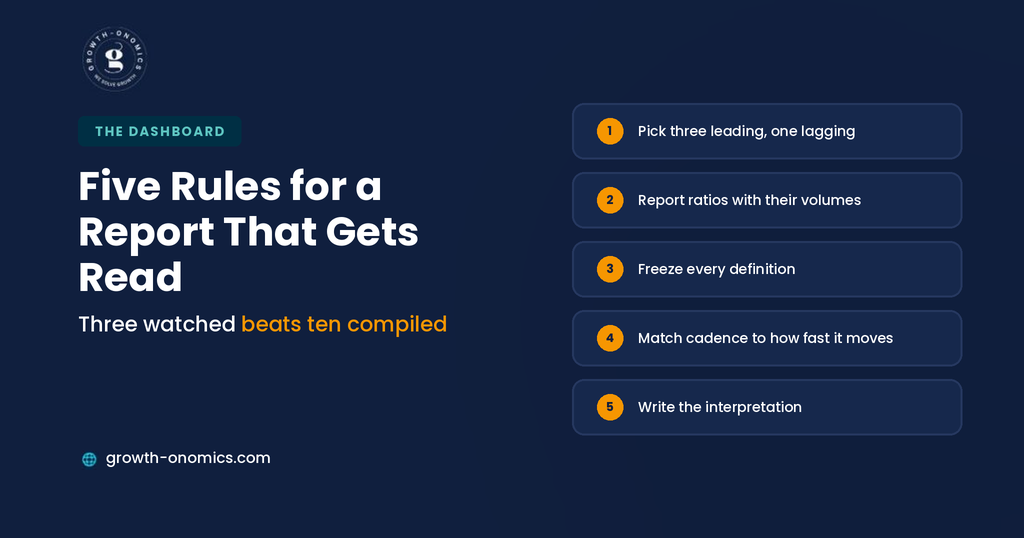
10 metrics is a menu. Reporting all of them monthly guarantees nobody reads any of them.
Pick three leading and one lagging. For most B2B SaaS teams, the strongest set is ICP-fit traffic ratio, bottom-funnel impression share, and demo page assisted sessions, validated quarterly against content-to-opportunity rate. Three that get watched beat ten that get compiled.
Report ratios with their volumes. Every ratio here can improve because the denominator fell. Showing both prevents the most common misreading in this kind of dashboard.
Freeze the definitions. Brand term lists, funnel-stage page classifications, ICP criteria, and prompt sets all need to be documented and held stable. Changing a definition and a metric in the same month makes the comparison meaningless, and it happens constantly.
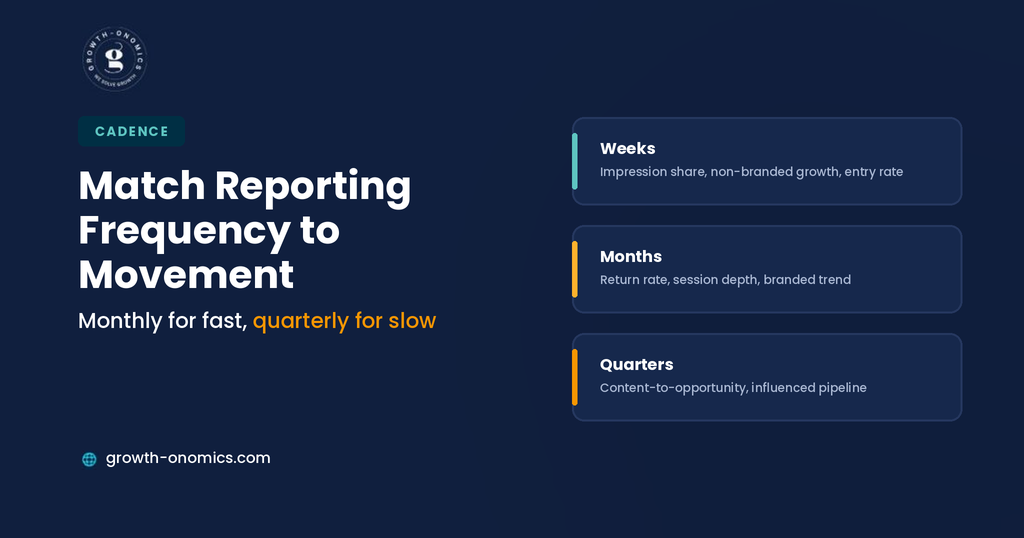
Match cadence to movement. Search Console metrics can be reviewed monthly. CRM-dependent metrics need a quarter to say anything, because the sales cycle has not finished. Reporting a lagging metric monthly produces noise that gets treated as signal.
Write the interpretation. A dashboard showing 8 numbers moving in different directions is not a report. Somebody has to say what changed and why, and that person needs to know what shipped. Growth-onomics structures client reporting this way; leading indicators reviewed monthly with a written read, lagging pipeline metrics quarterly because a number without an explanation gets ignored and a number with a wrong explanation gets acted on.
Conclusion
The reason organic search struggles to defend its budget is rarely that it fails to produce pipeline. It is that the metric everyone reports has almost no relationship to the outcome everyone is asked about, and the gap between them takes two quarters to become visible.
The 10 metrics here close that gap by narrowing to buying behavior, weighting for account fit, and measuring things that move early enough to act on. None of them requires exotic tooling; 4 come from Search Console alone, and 3 more from properly segmented analytics. Only two need a CRM connection, and those are the ones that validate the rest rather than replace them.
Pick 3 leading indicators and one lagging one. Freeze the definitions. Report the ratios with their volumes and write down what changed. That is a more defensible position than a traffic chart, and it changes the board conversation from whether SEO works to which parts of it are working.
If you want organic search measured against qualified demand rather than sessions, Growth-onomics can build the leading indicator set and the reporting around it.
FAQs
What is the single best predictor of SQLs from organic search?
ICP-fit traffic ratio, if you can measure it. It answers the only question that matters about traffic quality: whether the companies arriving from search look like the companies that buy, and it moves early enough to change your content plan. Building it requires firmographic enrichment through an attribution platform or reverse IP tool, which is a real cost. If that is not available yet, bottom-funnel impression share from Search Console is the strongest free substitute, because it tracks whether your visibility is moving toward buying queries or away from them.
How long before these metrics show a change?
It depends on the metric, which is why mixing cadences is important. Search Console signals impression share, non-branded growth, and branded trend move within weeks of publishing or improving pages, since they reflect visibility rather than outcomes. Behavioral metrics like return rate and session depth follow within a month or two. CRM-dependent metrics lag by your sales cycle, so a 90-day cycle means content published this quarter shows up in opportunity data next quarter at the earliest. Report the fast ones monthly and the slow ones quarterly.
Do I need an attribution platform to track these?
For 7 of the 10, no. Search Console covers 4 outright, and properly segmented analytics covers 3 more. ICP-fit traffic ratio needs firmographic enrichment, and content-to-opportunity rate needs attribution connecting sessions to CRM records. AI citation presence needs a visibility tool or manual prompt testing. Start with the 7 you can build today, since they cover the leading indicators, and add the CRM-connected metrics when budget and ops capacity allow. They validate the picture rather than creating it.
How do I stop these becoming another set of vanity metrics?
Two disciplines. First, always report ratios alongside their underlying volumes, because every ratio here improves when the denominator falls; bottom-funnel entry rate rises beautifully if your blog traffic collapses. Second, tie each metric to a decision. If a number moving would not change what you do next month, it does not belong in the report. Metrics become vanity when they are compiled rather than used, and the fastest way to test that is to ask what last month’s reading actually changed.
How do I present these to a board that only asks about revenue?
Lead with the lagging number and use the leading indicators to explain its direction. A board wants to know what organic produced and whether it is improving, so open with influenced opportunities and the methodology behind it, then show 2 or 3 leading indicators as the reason you expect the next quarter to move. That sequencing answers the question first and then earns attention for the earlier signals. Presenting leading indicators alone invites the same scepticism a traffic chart does, because neither answers what was asked.
Should AI citation presence really sit alongside traditional SEO metrics?
Yes, because it is measuring the same funnel stage through a different surface. A buyer asking an assistant which tool to choose is doing exactly what a buyer searching for a comparison page is doing, and being absent from that answer removes you from the shortlist with no trace in any traditional report; no impression, no click, nothing. Track it separately from your search metrics so the platforms do not get conflated, but report it in the same review, because it answers the same commercial question about whether you are present when decisions get made.
