
OVERVIEW
This project aimed to unlock the potential of marketing channels to drive customer acquisition, retention, and revenue growth based on a comprehensive dataset received from one of our clients.
Our thorough analysis of the dataset revealed key trends and patterns related to customer behaviour and preferences.
This case study outlines the analytical approach and methodologies employed by Growth-onomics to refine marketing strategies for clients, bolstering customer value and investment returns, all based on their data.
OBJECTIVES
The primary goal was to identify the optimal marketing mix for each revenue stream.
This was done by considering factors such as customer segment, channel effectiveness, and return on investment (ROI).
By scrutinising key metrics, Growth-onomics sought to optimise its marketing efforts, ensuring a more strategic allocation of resources to achieve the most effective results.
METHODOLOGICAL APPROACH
The project utilised an extensive dataset, consisting of 800 records spanning 5 critical dimensions.
- Customer_Id
- Channels
- Cost
- Conversion rate
- Revenue
- CLV (We added upon requirement)
The dataset provides insight into the revenue and cost distribution across several marketing channels, including paid advertising, email marketing, referrals, and social media. Marketing performance can then be evaluated thoroughly.
This analytical approach involves several key components:
Profit Margin Calculation: Subtract total costs from total revenues to find profit margin. This calculation reveals marketing efforts’ financial success.
Customer Lifetime Value (CLV) Analysis: CLV is calculated by subtracting the cost per customer from the revenue per customer. It assesses the long-term value a customer brings to the company.
Cost per CLV Unit: Calculated by dividing the total marketing cost by the total CLV. This metric measures how effectively marketing investments generate value for customers.
For customer revenue tier segmentation, the project adopted the following approach:
Data Preparation: The analysis began with a dataset featuring a ‘revenue’ column corresponding to each customer’s revenue contribution.
Quartile Calculation: Quartiles were applied to divide revenue data into 4 equal segments, allowing customers to be segmented into revenue tiers accordingly.
Tier Assignment: Customers were grouped into 4 tiers (Low, Medium, High, and Very High Revenue) based on their revenue quartile, facilitating targeted marketing campaigns.
Programmatic Segmentation: Utilising tools like the Pandas library in Python, segmentation was executed programmatically, ensuring fair distribution of customers across tiers.
IMPACT AND INSIGHTS
By analysing and segmenting data, Growth-onomics pinpointed valuable customer segments and helped them optimize their marketing.
Ultimately, this results in a better return on investment and a better example of how data-driven decisions can drive business growth.
Customer Segmentation
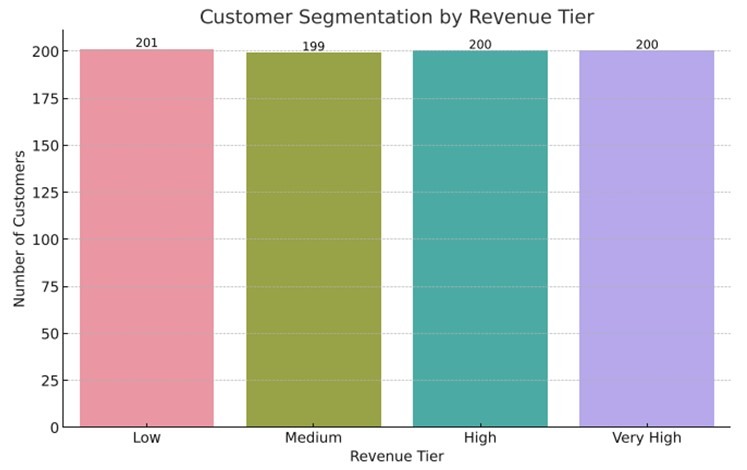
The bar graph above illustrates the distribution of customers across four revenue tiers: Low, Medium, High, and Very High.
Each tier has a close number of customers, with Low and Very High having slightly more at 201, and Medium and High each having 199 and 200, respectively.
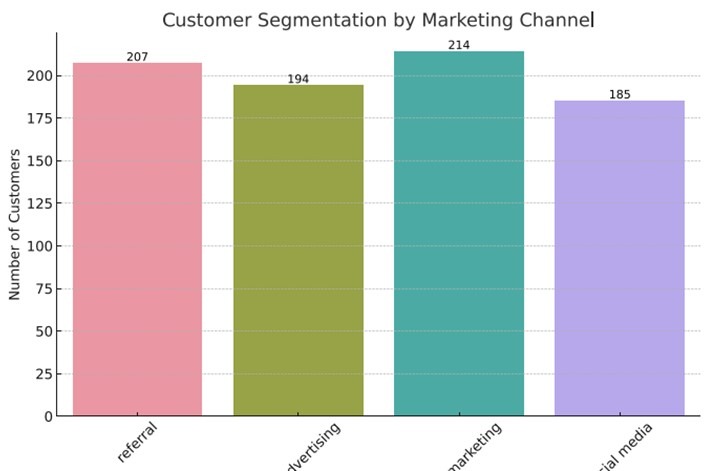
The bar chart depicts customer segmentation by marketing channel. The highest number of customers came from marketing (214), followed by referrals (207), advertising (194), and the least from social media (185).
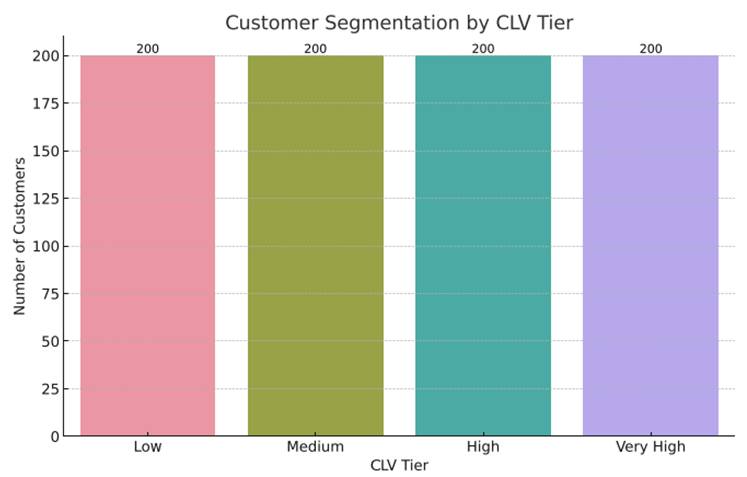
The chart shows an even distribution of customers across four Customer Lifetime Value (CLV) tiers, with each tier—Low, Medium, High, and Very High—having exactly 200 customers.
Channel Effectiveness
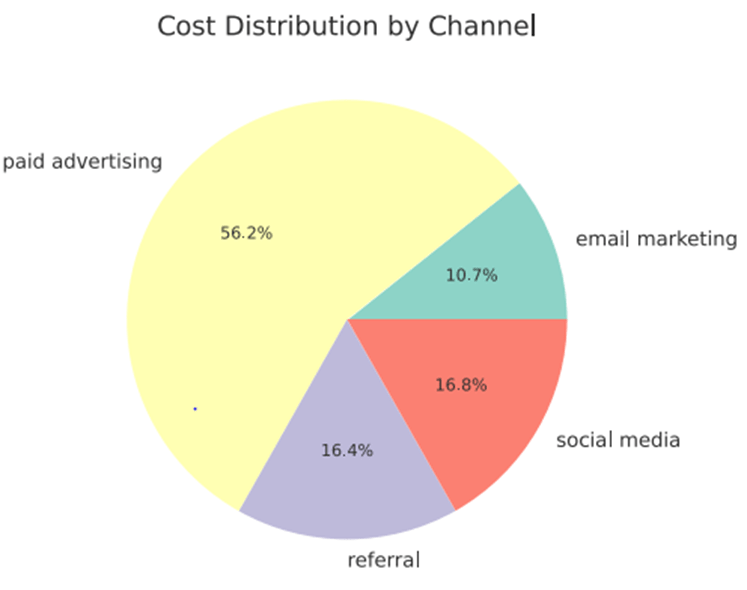
It’s evident from the pie chart that paid advertising is the most costly channel at 56.2%, followed by social media and referrals at 16.8% and 16.4% respectively, with email marketing incurring the lowest cost at 10.7%.
Here’s a pie chart showing revenue distribution by channel.
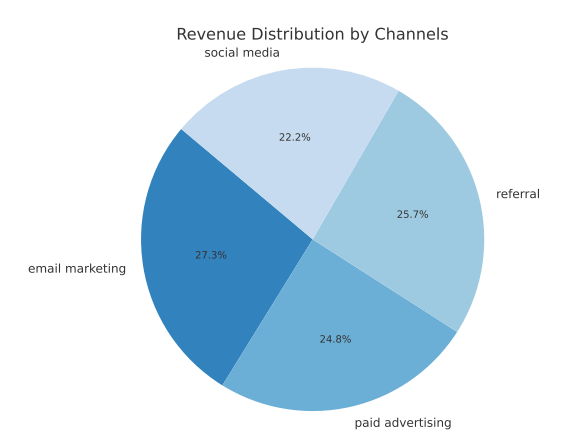
In terms of revenue, email marketing ranks first, referrals rank second, followed by paid advertising, while social media ranks last.
Cost Analysis
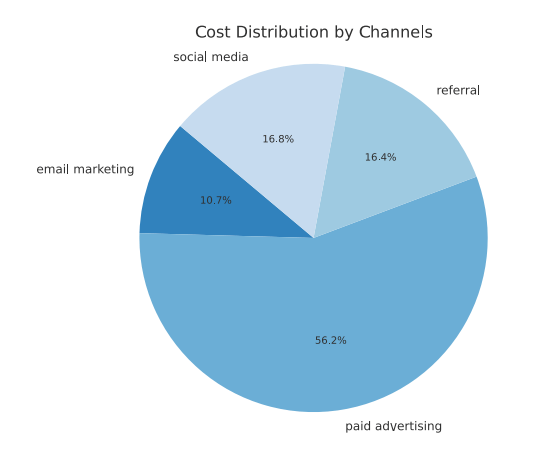
The pie chart shows the total cost per marketing channel, with paid advertising dominating at (56.2%), while social media and referrals each incur somewhat similar costs (16.8% and 16.3%, respectively), while email marketing costs the least (10.7%).
Conversion Rate Analysis
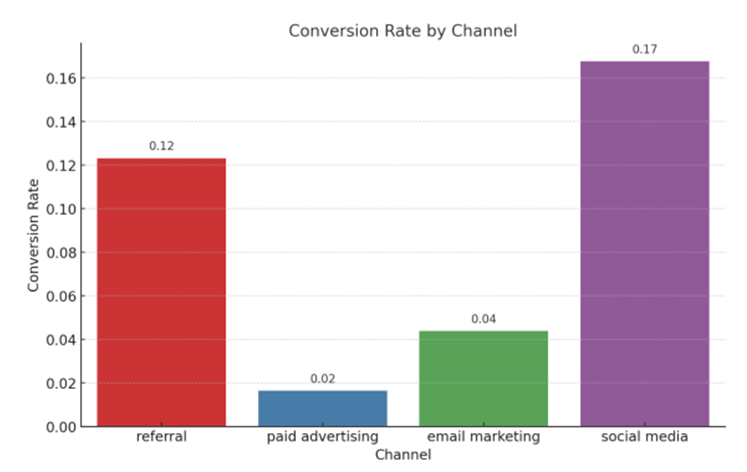
As shown in the bar chart, average conversion rates vary with the channel, the highest being social media leads at 0.17, referrals at 0.12, email marketing at 0.04, and paid advertising lowest at 0.02.
Revenue and Profitability
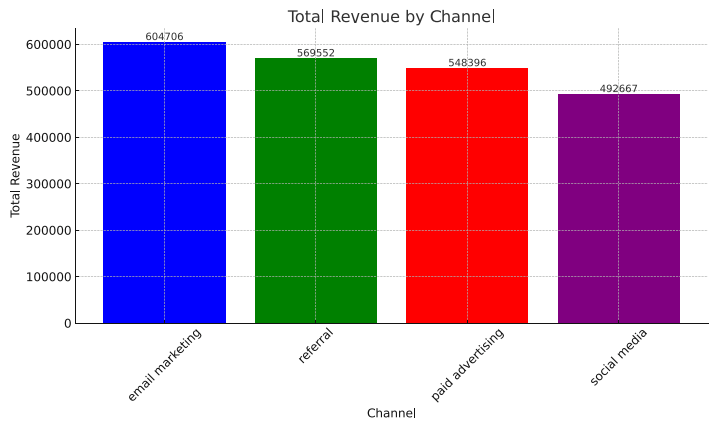
In this bar graph, total revenue is shown by channel, with email marketing generating the most revenue, and social media generating the least.
The bar chart displays the average cost by marketing channel.
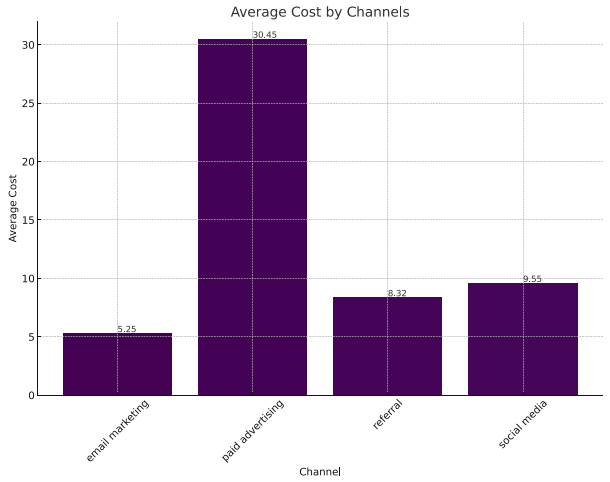
According to the results, the most expensive method was paid advertising at $30.45, followed by social media at $9.55, referrals at $8.32, and email marketing at $5.25.
Relationship Between Marketing Cost and Customer Lifetime Value (CLV) by Channel
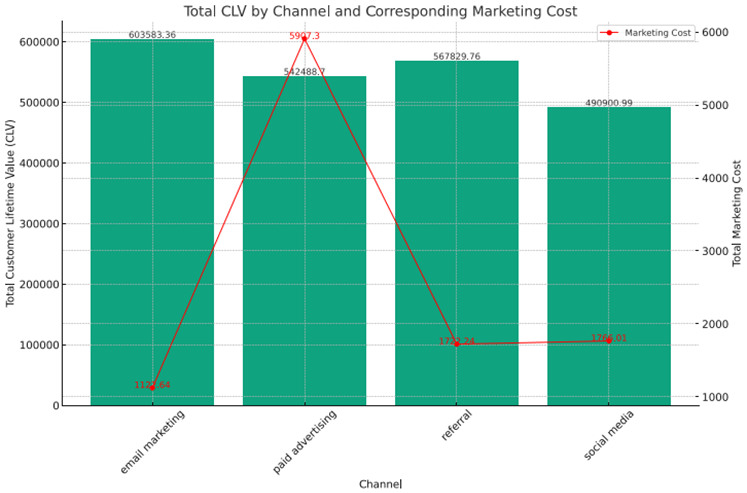
The bar graph compares the total Customer Lifetime Value (CLV) by channel with their corresponding total marketing costs, revealing that email marketing produces the lowest CLV, while paid advertising does not lead to CLV, but has the highest cost.
Referrals and social media have lower CLVs with moderate costs.
Relationship Between Conversion Rate and Revenue by Channel
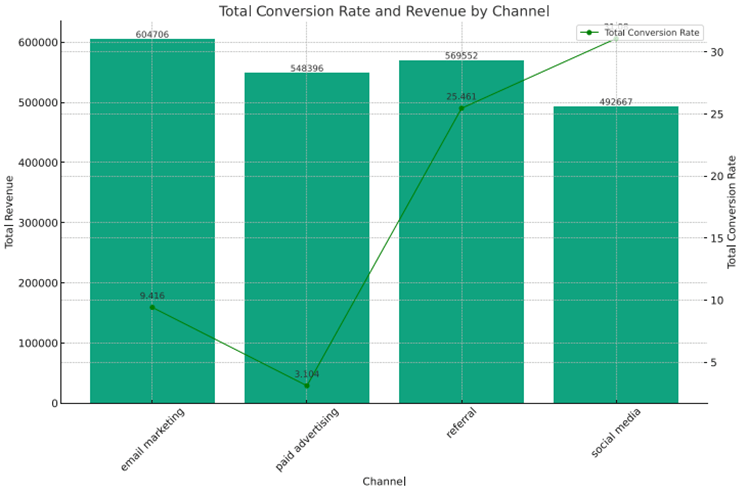
Based on the graph, email marketing has the highest revenue and conversion rate and is the second-lowest of all channels, with social media having the lowest revenue but the highest conversion rate.
Among all channels, paid advertising has the second-lowest revenue and conversion rate, while referral has the second-highest.
CONCLUSION
The focused analysis on Customer Lifetime Value (CLV) in this case study revealed the huge impact of data-driven strategies on marketing effectiveness and customer engagement for our client.
By prioritising CLV, the initiative underscored the necessity of understanding long-term customer value when optimizing marketing investments.
Based on the results of this case study, it is apparent that CLV analysis plays a critical role in shaping marketing strategies for sustainable growth and profitability.